.webp) Online
OnlineNot sure which channel fits your business?View all services →
Three inputs. Instant KPIs. No spreadsheets.Open a calculator →
OnlineWhile mobile devices drive over 70% of web traffic, the average UK mobile conversion rate has stalled at just 1.8% in 2026. This stark contrast against the 3.9% desktop average illustrates the widening performance gap between brands that simply buy traffic and those that engineer conversions. If you...

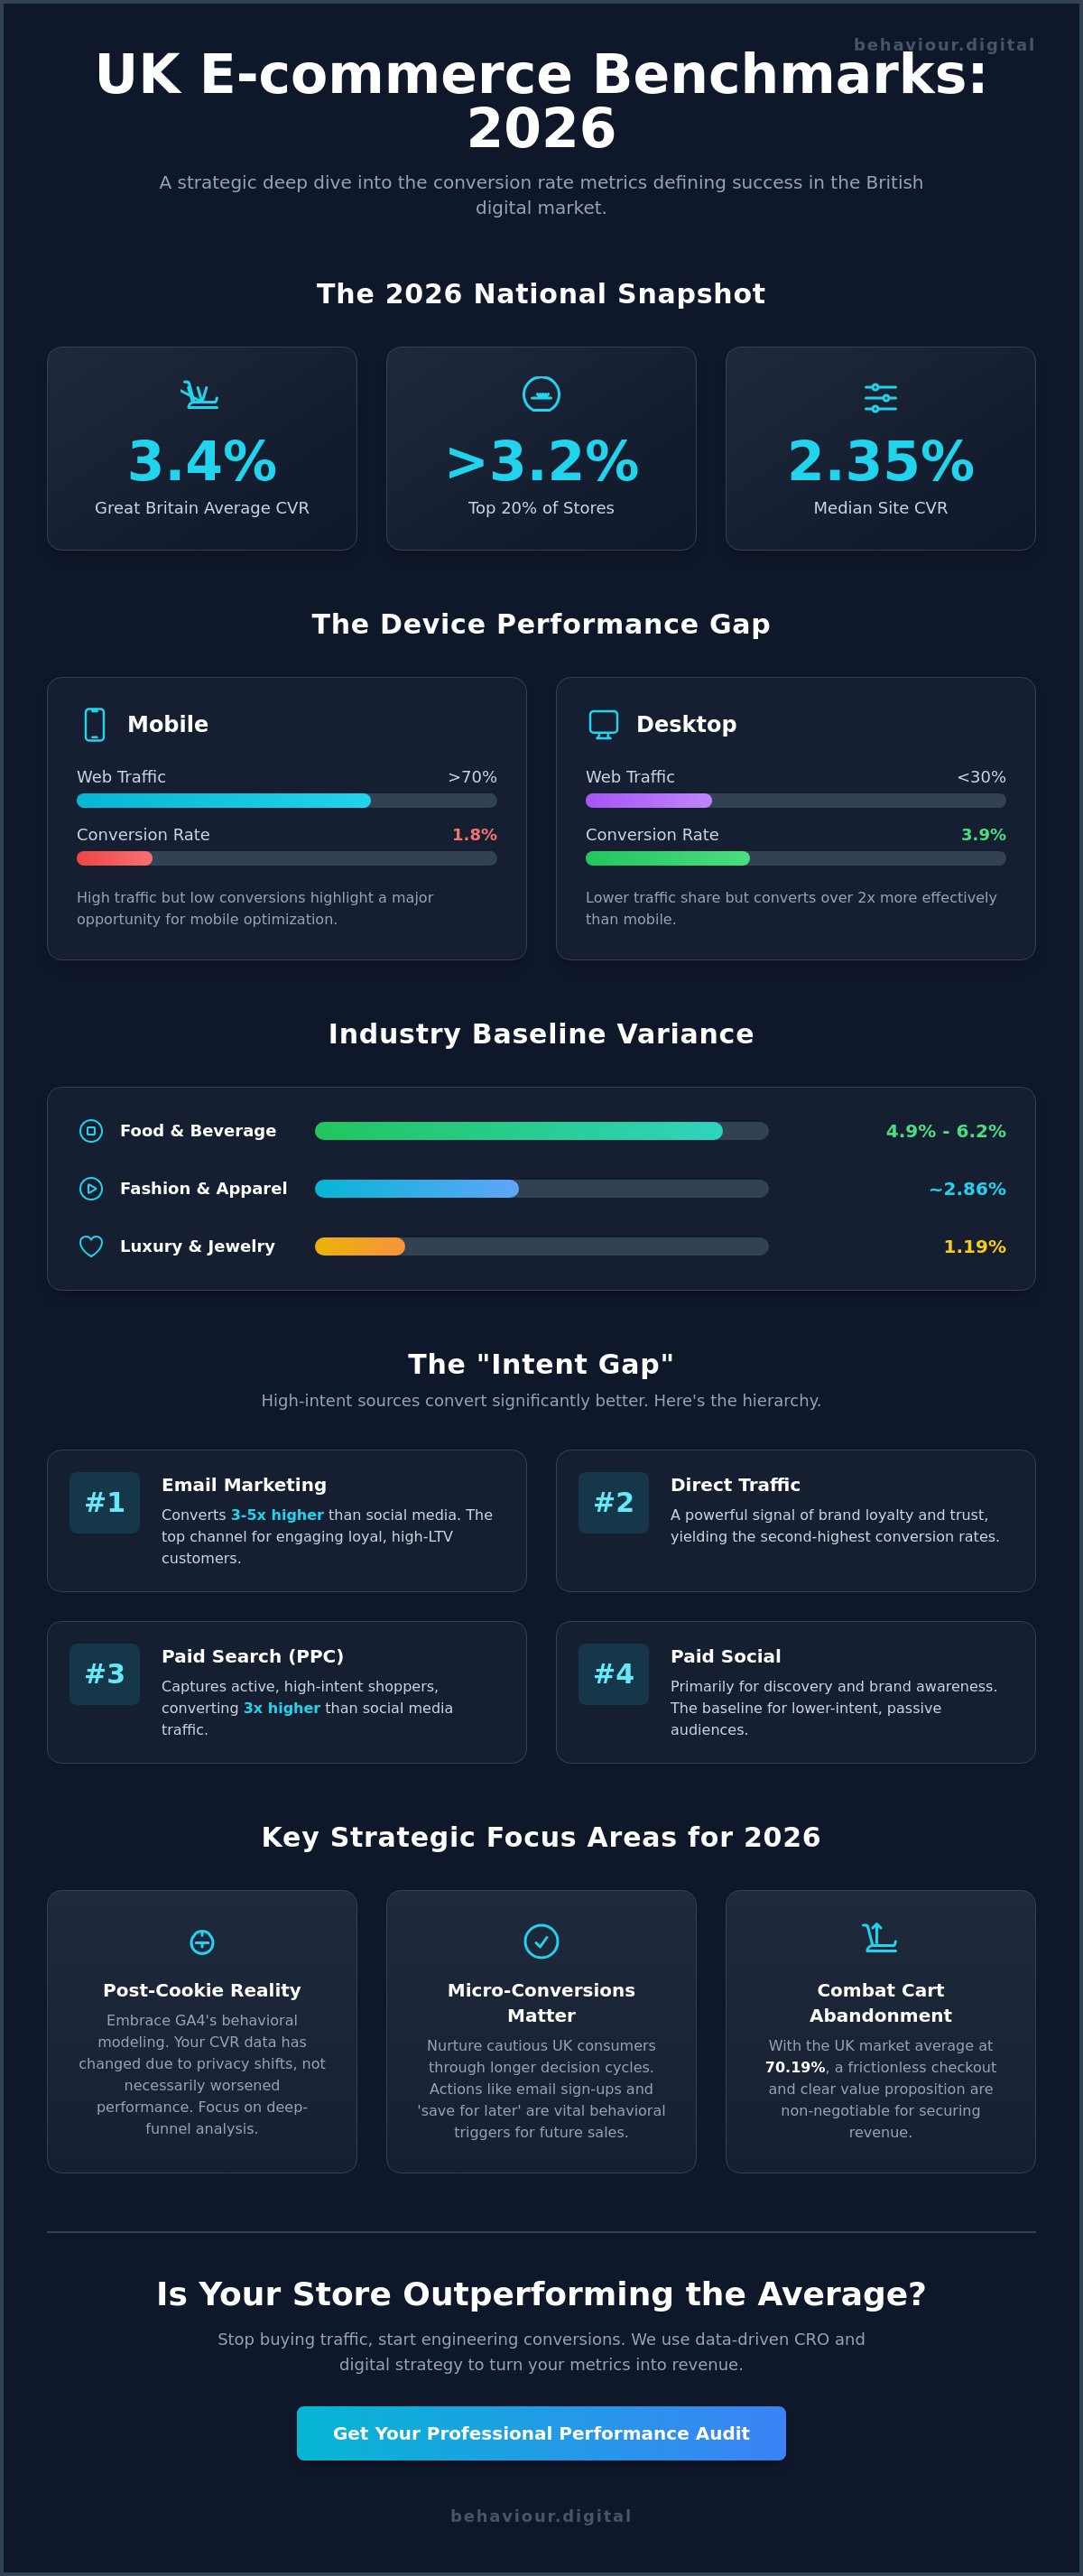
While mobile devices drive over 70% of web traffic, the average UK mobile conversion rate has stalled at just 1.8% in 2026. This stark contrast against the 3.9% desktop average illustrates the widening performance gap between brands that simply buy traffic and those that engineer conversions. If you're struggling with stagnant sales despite heavy investment in Meta and Google, you're not alone. Rising customer acquisition costs and the complexity of GA4 often make it difficult to determine if your store is truly performing or just surviving.
You deserve professional validation of your metrics based on the latest ecommerce conversion rate benchmarks uk 2026. We understand that benchmarks are merely a floor, not a ceiling. This guide delivers the precise data points you need, including the 3.4% Great Britain average and industry-specific breakdowns, to help you outpace your competitors. You'll discover a methodology to improve your results through conversion rate optimization and digital strategy without inflating your advertising budget. We'll analyze why the top 20% of stores now exceed a 3.2% conversion rate and how you can join them by aligning high-intent traffic with behavioral triggers.
• Access the latest ecommerce conversion rate benchmarks uk 2026 to validate your store's performance against the 3.4% national average.
• Understand why the top 20% of retailers are now exceeding 3.2% and why high-performing brands set targets significantly above the national baseline.
• Identify performance variations between traffic sources and devices to refine your customer acquisition and digital strategy.
• Deploy behavioral triggers and optimize for 2026 Core Web Vitals to increase revenue without expanding your current ad spend.
• Discover how integrating PPC management with conversion data solves the problem of stagnant sales and rising acquisition costs.
In the 2026 British digital market, the e-commerce conversion rate (CVR) represents the percentage of site visitors who complete a transaction. It's the primary metric for assessing the efficiency of your Conversion rate optimization (CRO) efforts. As of April 2026, Great Britain's average e-commerce conversion rate stands at 3.4%, while the median site achieves 2.35%. These figures reflect a stabilizing economy where shoppers have become more selective. While macro-conversions, or final sales, remain the ultimate goal, successful 2026 strategies rely heavily on micro-conversions. Actions like email sign-ups or "save for later" clicks are vital to nurture cautious UK consumers through longer decision cycles.
Consumer confidence in the UK has shifted toward value-driven and transparent brand interactions. Shoppers don't just click "buy" on their first visit. They compare. This behavior has led to a median conversion rate increase of only 0.18% over the last year. It's a marginal gain that rewards brands with a clear digital strategy. If your site isn't hitting these ecommerce conversion rate benchmarks uk 2026, it often indicates a friction point in the user journey rather than a lack of market demand.
Industry sector dictates your performance ceiling. Food & Beverage continues to lead the UK market with conversion rates between 4.9% and 6.2%. This efficiency is driven by repeat purchase behavior and the essential nature of the products. Conversely, the Luxury & Jewelry sector faces a steeper challenge with a 1.19% average. High-ticket items require multiple touchpoints and significant trust-building. Fashion & Apparel brands typically hover around the 2.86% B2C average. Low-ticket items benefit from impulse buying, while high-ticket British brands must fight the 70.19% cart abandonment rate currently seen across the market.
Measurement changed fundamentally by May 2026. Privacy regulations have largely dismantled traditional "last-click" attribution models. Most UK retailers now use GA4's behavioral modeling to fill data gaps caused by cookie rejection. This shift means your reported CVR might look different than it did in 2024. It's not necessarily because your store is performing worse; it's because the data is now filtered through machine learning to account for non-consenting users. Success in this landscape requires a move away from surface-level metrics toward deep-funnel analysis that identifies where users actually drop off.
Data without segmentation is merely noise. While the national average provides a baseline, true growth comes from understanding how different channels interact with British consumers. In 2026, the "Intent Gap" remains the most significant factor in performance variance. This gap describes the difference between users actively searching for a product and those passively discovering it. It's why paid search traffic typically converts at a rate three times higher than social media traffic. According to a UK eCommerce market overview, the British market is one of the most technologically advanced, meaning users expect a seamless transition from discovery to checkout regardless of the source.
Direct traffic has also emerged as a critical metric for 2026. High volumes of direct traffic are a strong signal of UK brand loyalty. These users bypass search engines and social platforms because they already trust the merchant. Consequently, direct traffic often yields the highest conversion rates, second only to email marketing, which converts 3-5 times higher than social media. If you aren't seeing this loyalty in your data, your digital strategy likely needs a shift toward retention and brand building.
Google Ads remains the gold standard for capturing high-intent shoppers in the UK. For 2026, top-performing brands are seeing conversion rates well above the 3.4% national average on search. On the social side, TikTok Shop has gained significant traction among younger demographics, yet Instagram Checkout still maintains a higher conversion efficiency for established apparel brands. Navigating these platforms requires local expertise to avoid overspending on low-intent clicks. If you're looking to refine your acquisition strategy, consulting a PPC agency Glasgow can provide the localized context needed to outperform national averages.
Mobile devices now account for approximately 70-75% of all UK e-commerce traffic. Despite this dominance, a significant performance gap persists; mobile conversion rates hover around 1.8%, while desktop conversion rates reach 3.9%. This discrepancy is fueled by the "Mobile Friction Tax," which is the quantifiable revenue loss occurring when mobile user experience hurdles prevent high-intent visitors from completing a purchase. However, the widespread adoption of Apple Pay and Google Pay has begun to mitigate this. Retailers who have fully integrated these one-tap payment solutions report a significant reduction in cart abandonment, which currently sits at a market average of 70.19%.
Accepting the 3.4% UK average as a success metric is a strategic error. Benchmarks are diagnostic, not aspirational. If your store sits at the 2.35% median, you aren't just "average"; you're likely losing market share to the top quartile of retailers who consistently hit 5% or higher. According to the latest e-commerce statistics, the gap between market leaders and laggards is widening, leaving little room for those who settle for the middle ground.
High conversion rates can also be deceptive if they aren't balanced against Average Order Value (AOV). A 10% CVR on low-margin, high-volume items may generate less profit than a 1.5% CVR in the luxury sector. Similarly, your ecommerce conversion rate benchmarks uk 2026 can be artificially deflated by "junk traffic." Poorly managed social campaigns often flood sites with low-intent visitors. This skewing of data makes it appear as though your website is failing, when the reality is a misalignment in your acquisition funnel. You must look beyond the top-level percentage to understand the quality of the users you're attracting.
Small incremental gains in conversion have a compounding effect on your bottom line. A 1% increase in CVR doesn't just mean more sales; it can effectively double your marketing efficiency by lowering your effective CAC. This is where a robust Digital Strategy becomes indispensable. It allows you to calculate your "Breakeven CVR," the exact point where your ad spend becomes self-sustaining. By focusing on customer lifetime value rather than just the initial transaction, you create a scalable model that thrives even when platform costs rise.
British consumers have specific expectations that, if unmet, create immediate friction. Delivery costs remain the primary reason for cart abandonment, which currently averages 70.19% across the UK. Furthermore, the demand for "Click & Collect" options has become a baseline requirement for many shoppers. Transparency is equally vital. Failing to show VAT-inclusive pricing until the final checkout stage is a guaranteed way to spike abandonment rates. We recommend using heatmaps to validate user behavior. If your data shows users are scrolling past your primary CTAs without interacting, you have a visibility leak that no amount of traffic can fix. Eliminating these friction points is the fastest way to move from the median into the top performing quartile.
Surpassing ecommerce conversion rate benchmarks uk 2026 requires a shift from passive observation to aggressive, methodology-led intervention. While knowing that the top 20% of stores exceed a 3.2% CVR is useful, achieving it requires implementing behavioural triggers that resonate with British psychological cues. Scarcity and urgency tactics must remain UK-compliant; they should reflect genuine stock levels or time-limited offers to maintain consumer trust. Personalisation has also evolved. By 2026, using AI to dynamically display relevant products to returning visitors isn't just an advantage; it's a requirement to keep engagement high.
Technical performance is equally critical. Meeting 2026 Google standards for Core Web Vitals ensures that your site remains visible and functional. Slow-loading pages are a primary driver of the "Mobile Friction Tax" discussed earlier. When it comes to the checkout, the debate between one-page and multi-step layouts has shifted. For many UK retailers, a streamlined multi-step process that clearly validates each stage of the transaction often outperforms a cluttered single page. The goal is to reduce cognitive load, making the path to purchase as frictionless as possible.
Meaningful growth doesn't come from testing button colours. You must test your fundamental value propositions. For smaller Scottish e-commerce sites, running statistically significant tests requires a focused approach, often prioritising high-traffic checkout pages over low-traffic landing pages. Our framework for conversion optimisation focuses on isolating variables that directly impact the user's decision-making process. This systematic refinement ensures that every change is backed by quantitative data rather than subjective preference.
Unexpected shipping fees remain the primary reason for abandonment in the British market. Transparency is your strongest tool here. Displaying all costs early in the funnel prevents the sticker shock that leads to a 70.19% abandonment rate. Additionally, integrating "Buy Now, Pay Later" (BNPL) options has become essential for maintaining competitiveness in 2026. Trust signals like Trustpilot or Norton icons provide the professional validation UK shoppers require before entering payment details. If your checkout process feels like a barrier, it's time to re-evaluate your Conversion Rate Optimization strategy to reclaim lost revenue.
Benchmarks are meaningless without a roadmap to surpass them. Most agencies treat traffic and conversion as unrelated metrics, but we eliminate this silo by integrating PPC Management directly with real-time conversion data. This holistic view allows us to pinpoint the exact "revenue leaks" mentioned earlier, such as the mobile friction tax or the 70.19% checkout abandonment rate prevalent in the UK market. We don't rely on marketing fluff; we focus on quantitative data to ensure your store doesn't just meet but exceeds the ecommerce conversion rate benchmarks uk 2026.
Our Glasgow-based team provides the essential context required for UK and Scottish brands to thrive. We understand the specific consumer behaviors and logistical expectations, such as the demand for "Click & Collect" and the necessity of VAT-inclusive pricing, that define the British e-commerce environment. Our methodology is built on data transparency and measurable business growth. We position ourselves as a strategic partner, taking full responsibility for the shared goal of scaling your revenue through a disciplined digital strategy.
We leverage search intent data to inform every aspect of landing page design. If a user arrives via a high-intent Google search, the landing page must reflect that specific urgency and provide an immediate solution. Our recent work with UK retailers has shown that aligning social media marketing with behavioral triggers can significantly lift CVR without increasing total spend. Investing in conversion rate optimization creates a long-term asset that makes every pound of your ad spend work harder.
Your journey toward outperforming the market begins with a professional conversion audit. We analyze your entire funnel to find where users drop off and why. Within the first 90 days of a partnership, we move from data collection to active testing and refinement. You'll see a clear transition from baseline performance to a methodology-led growth engine. This systematic approach ensures your digital strategy is built on facts, not assumptions.
Don't settle for the 3.4% national average. Book a strategy session with Behaviour Digital today to start outperforming the ecommerce conversion rate benchmarks uk 2026.
Understanding the ecommerce conversion rate benchmarks uk 2026 is only the first step toward market leadership. We've established that the gap between the 2.35% median and the 5% top-quartile performers is bridged by a systematic approach to behavioral triggers and technical optimization. Relying on "average" results in 2026 is a recipe for stagnation. You must align your high-intent traffic with a frictionless user journey to effectively lower your acquisition costs and maximize lifetime value.
Sustainable growth requires a strategic partner who looks beyond surface-level metrics. As Glasgow-based experts in the UK market, we specialize in merging PPC management with conversion rate optimization to eliminate revenue leaks. Our methodology is rooted in data transparency and measurable business outcomes; we ensure every change we implement is backed by quantitative evidence. It's time to stop guessing and start engineering your success.
Ready to beat the UK benchmarks? Book your 2026 Strategy Session with Behaviour Digital
Your store has the potential to outperform the industry average. With the right methodology and a focus on continuous refinement, you can turn these benchmarks into a platform for scalable, predictable growth.
A good conversion rate is relative to your sector, but the 2026 UK average is 3.4%. To be in the top 20% of retailers, you need to exceed 3.2%, while the median site sits at 2.35%. Aiming for 5% or higher places you in the top quartile of performers. These ecommerce conversion rate benchmarks uk 2026 serve as a diagnostic floor rather than a performance ceiling for your growth.
Site speed is a primary driver of user retention and conversion efficiency. In 2026, failing to meet Google’s Core Web Vitals standards triggers immediate bounces, particularly for mobile users. Every second of delay correlates with a measurable drop in CVR. Technical performance isn't just an IT concern; it's a critical component of your digital strategy and overall bottom-line profitability.
This discrepancy is usually caused by the "Mobile Friction Tax," where small UX hurdles prevent purchase completion. While mobile drives over 70% of traffic, the UK mobile CVR is approximately 1.8% compared to 3.9% on desktop. Users often use mobile for discovery and desktop for the final transaction. Integrating one-tap payments like Apple Pay is the most effective way to close this performance gap.
Social media typically has a lower CVR because of the "Intent Gap" between channels. PPC captures users actively searching for a product, leading to conversion rates that are often 3x higher than social media. Social media marketing focuses on discovery and top-of-funnel engagement. While social CVR is lower, it's essential for feeding the funnel that your high-intent campaigns eventually convert.
Unexpected shipping fees and a lack of pricing transparency are the leading causes of the 70.19% UK cart abandonment rate. Other major killers include mandatory account creation and slow, multi-page checkout processes. British consumers also expect trust signals like Trustpilot reviews and clear VAT-inclusive pricing. Removing these friction points is the fastest way to improve performance without increasing your advertising spend.
You should perform a comprehensive audit at least every six months to stay aligned with shifting consumer behaviors. The digital landscape moves quickly, and what worked in 2024 is often obsolete by mid-2026. Frequent audits allow for the methodology-led fine-tuning required to maintain a competitive edge. This proactive approach ensures your conversion rate optimization efforts remain focused on the highest-impact revenue leaks.
A Glasgow-based partner provides the localized context and data-driven precision needed to scale across the UK. Local experts understand the specific nuances of the British market, from delivery expectations to regional consumer trends. By merging PPC management with conversion data, a specialized agency identifies revenue leaks that generic providers often overlook. This partnership ensures your national strategy is grounded in measurable results.
A 1% CVR is actually near the industry average of 1.19% for the Luxury & Jewelry sector. High-ticket items involve longer decision cycles and more touchpoints, which naturally lowers the conversion percentage. In this sector, you should focus on Average Order Value (AOV) and customer lifetime value rather than chasing high-volume benchmarks. A 1% rate is often highly profitable when your digital strategy prioritizes margin over transaction volume.

Luke leads strategy across every Behaviour Digital account — building data-driven advertising systems for ambitious brands. When he's not auditing ad accounts, he's writing about what he found in them.
Get a free, tailored growth plan — we'll run our framework on your accounts and show you exactly what we'd do.
Get your free growth plan →