.webp) Online
OnlineNot sure which channel fits your business?View all services →
Three inputs. Instant KPIs. No spreadsheets.Open a calculator →
OnlineA PPC dashboard is a liability if it only tracks clicks; it becomes an asset when it tracks the methodology of growth. Most performance marketers spend hours manually stitching together data from Google, Meta, and LinkedIn, only to end up with a spreadsheet that fails to show true ROI. It's a common...

A PPC dashboard is a liability if it only tracks clicks; it becomes an asset when it tracks the methodology of growth. Most performance marketers spend hours manually stitching together data from Google, Meta, and LinkedIn, only to end up with a spreadsheet that fails to show true ROI. It's a common frustration where manual entry leads to errors and strategic insights are lost in a sea of raw metrics. You need a system that translates complex data into clear business outcomes without the administrative burden.
This guide introduces a professional ppc reporting dashboard template designed to transform your advertising data into a high-performance asset. You'll learn how to build a fully automated suite that leverages the April 2026 rebranding of Data Studio and its new cross-data source filtering capabilities. We'll show you how to integrate the Meta Conversions API, which helps advertisers achieve an average of 17% lower cost per result through more accurate attribution. We'll move beyond vanity metrics to create a reporting framework that ensures every dollar spent is a conscious step toward measurable success.
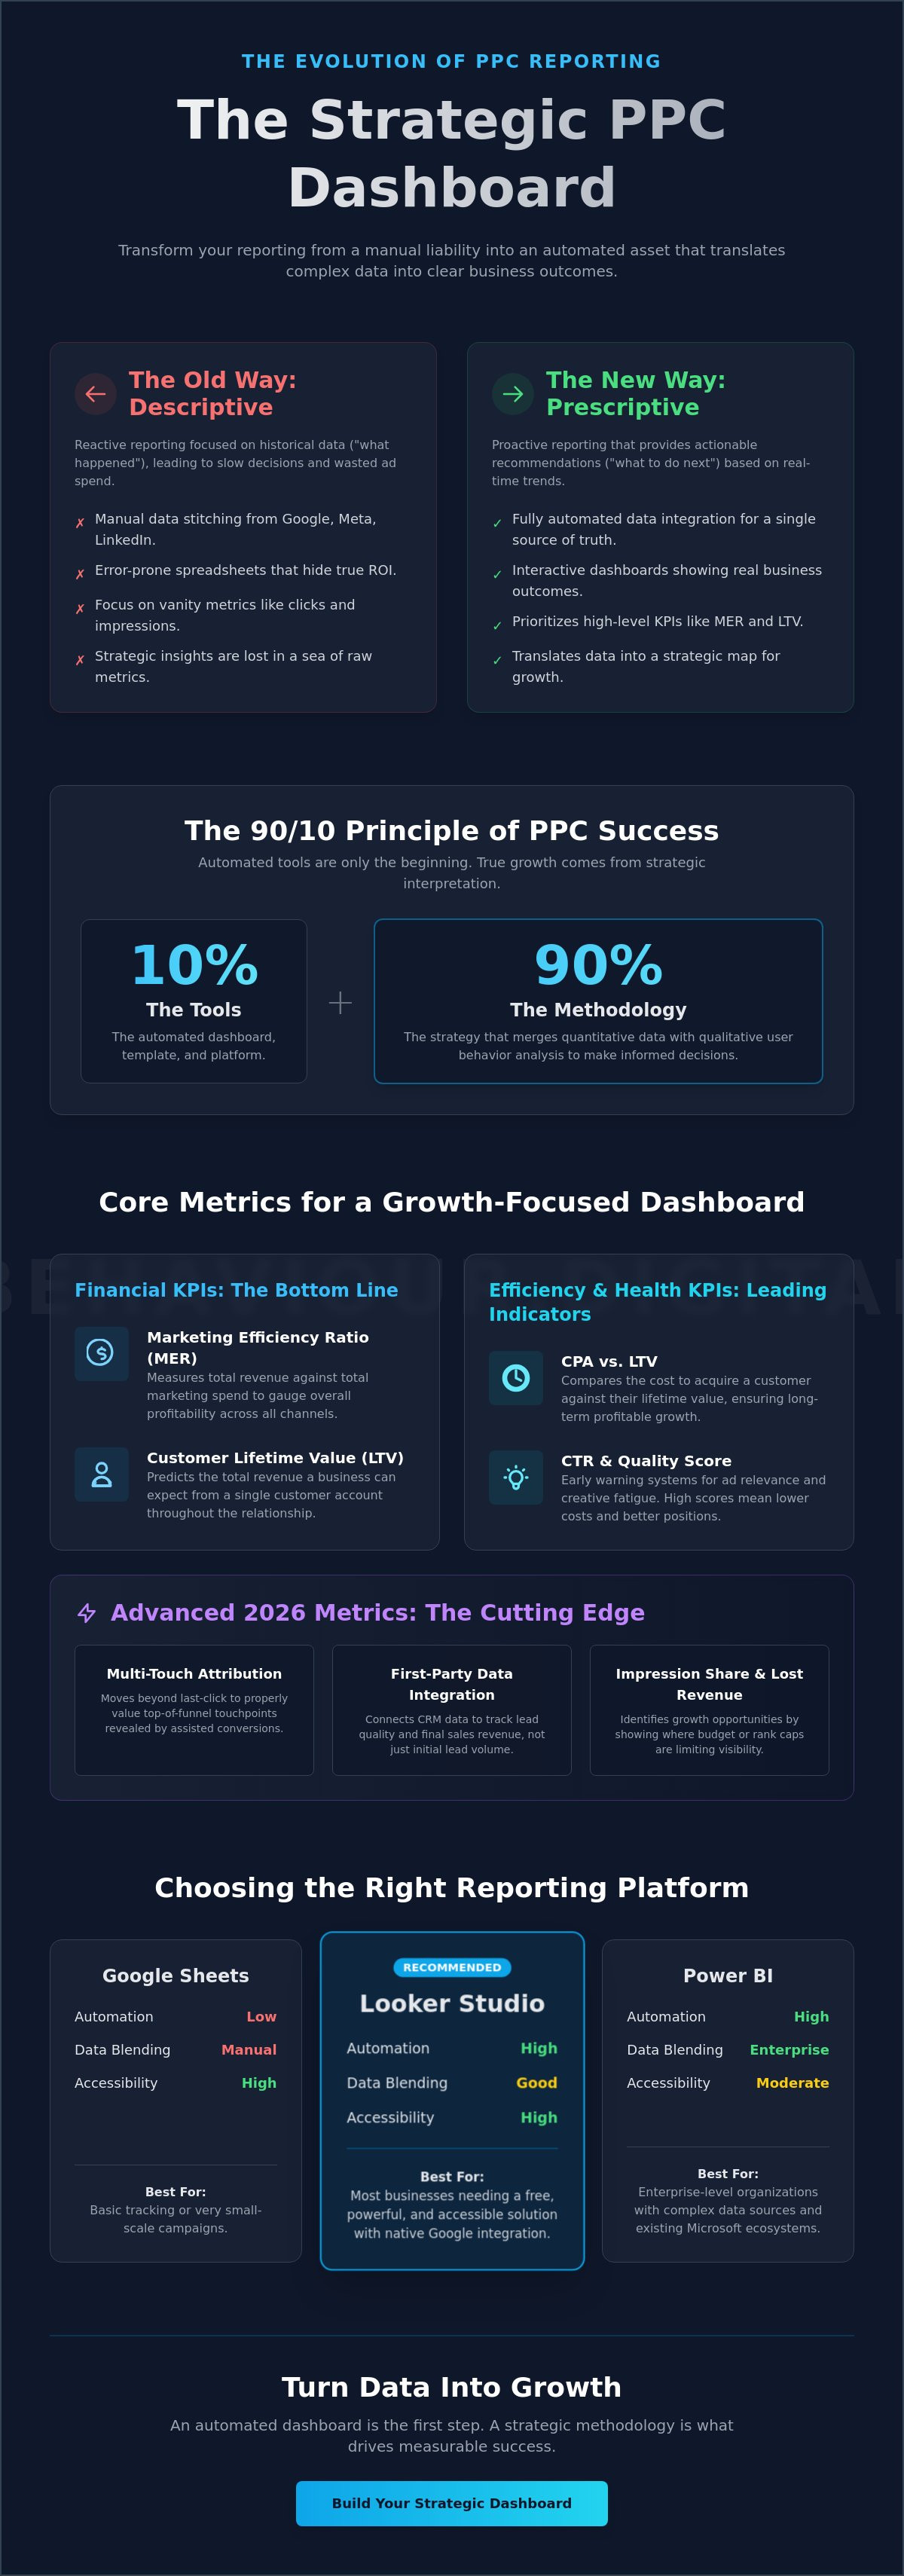
• Transition from descriptive to prescriptive reporting by shifting focus from historical data to actionable strategic recommendations.
• Prioritize high-level financial KPIs like Marketing Efficiency Ratio (MER) and customer Lifetime Value (LTV) to measure the true impact of PPC on business profitability.
• Select the optimal platform for your needs, balancing the native accessibility of Data Studio with the enterprise-level data blending capabilities of Power BI.
• Implement a professional ppc reporting dashboard template to eliminate manual data entry and ensure consistency across fragmented channels like Google, Meta, and LinkedIn.
• Recognize that automated tools are only 10% of the solution; the remaining 90% relies on a methodology that merges quantitative data with qualitative user behavior analysis.
A strategic dashboard is more than a collection of charts. It's a centralized visual interface that bridges the gap between ad platform APIs and business intelligence tools. By 2026, the standard for a ppc reporting dashboard template has shifted from merely displaying data to interpreting it. It provides the technical infrastructure needed to manage Pay-per-click (PPC) campaigns with surgical precision, ensuring that raw numbers translate into business intelligence.
Most businesses rely on descriptive reporting, which explains what happened in the past. This approach is reactive. A strategic dashboard prioritizes prescriptive reporting. It answers the question "what do we do next?" based on real-time performance trends. In an era of cookie deprecation and fragmented tracking, having a single source of truth isn't a luxury. It's a requirement for survival. It creates a transparent environment where agencies and clients can align on facts rather than assumptions.
Static PDF reports are obsolete by the time they reach an inbox. Strategic dashboards offer interactive, real-time environments where data flows continuously from the source. Vanity metrics, such as high impression counts or clicks, often mask underlying issues like poor conversion quality. A well-constructed ppc reporting dashboard template highlights these discrepancies immediately. This visibility allows for faster PPC Management decisions that protect your ad spend from being wasted on underperforming segments. It turns data into a map, not just a mirror.
Effective reporting serves three distinct groups within an organization. Specialists need granular data. They analyze keyword performance, search term reports, and ad copy variations to optimize at the ground level. Executives require a different lens. They focus on high-level ROAS, Customer Acquisition Cost (CAC), and the total impact on the bottom line. Finally, the client view centers on transparency and trust. The dashboard acts as a window into the strategy's execution, proving that every tactical move aligns with long-term business KPIs. When everyone looks at the same data, the path to growth becomes clear.
Data without context is noise. A robust ppc reporting dashboard template must prioritize metrics that reflect actual business growth rather than platform-specific vanity numbers. Financial KPIs form the foundation of this framework. While Return on Ad Spend (ROAS) remains a staple, it's often insufficient for scaling. You must track the Marketing Efficiency Ratio (MER) to understand how total spend impacts total revenue across all channels. This macro-view ensures profitability isn't sacrificed for high-volume, low-margin sales, especially as tools like the Google Ads API v24 now provide detailed cart-level profit reporting.
Efficiency KPIs refine this focus by comparing Cost Per Acquisition (CPA) against the Lifetime Value (LTV) of the customer. If your CPA exceeds the initial transaction value but remains well below the LTV, your campaigns are successfully fueling long-term expansion. Beyond these financial layers, your dashboard should monitor essential PPC metrics like Click-Through Rate (CTR) and Quality Score. These serve as early warning systems for creative fatigue or poor ad relevance. High engagement signals healthy creative assets, while assisted conversions reveal the hidden value of top-of-funnel touchpoints that don't receive direct credit in last-click models.
The 2026 landscape demands a shift in how we interpret attribution. With Meta's March 2026 update separating link clicks from "engage-through" actions, your ppc reporting dashboard template needs to account for multi-touch journeys. Relying on last-click data alone will lead to underfunding your most effective awareness campaigns. Integrating first-party data signals from your CRM is equally critical. This allows you to track lead quality and final sales rather than just lead volume. Additionally, monitoring Impression Share and Lost Revenue identifies exactly where budget constraints are capping your market reach.
A strategic dashboard maps the entire user journey, from Top-of-Funnel (TOFU) awareness to Bottom-of-Funnel (BOFU) conversion. This visualization helps pinpoint exactly where users drop off. If your TOFU metrics are strong but conversions are lagging, it often points to landing page friction. Incorporating conversion optimisation data into your reporting suite clarifies whether the issue lies with the traffic source or the user experience. While ROAS measures platform-specific revenue, MER provides a more holistic view of spend by calculating the ratio of total marketing investment against total business revenue. If your current reporting lacks these dimensions, it's time to audit your digital strategy for hidden inefficiencies.
Selecting the right technical infrastructure for your ppc reporting dashboard template is a strategic decision that dictates your ability to scale. The choice isn't merely about visual preference; it's about the platform's capacity to handle data volume and complex cross-channel blending. By mid-2026, the landscape has stabilized into three distinct tiers based on business complexity and technical requirements. Choosing the wrong tool often leads to data silos or performance bottlenecks that hinder rapid decision-making.
Following the April 2026 rebranding back to its original name, Data Studio (formerly Looker Studio) remains the industry benchmark for native Google Ads integration. It's the most accessible entry point for performance marketers. The platform recently introduced a 10x row limit increase, allowing visualizations to handle up to 50,000 rows in public preview. This makes it significantly more robust for high-volume accounts than in previous years.
The base version remains free. It offers seamless, real-time connections to the Google ecosystem and features an intuitive drag-and-drop interface.
While Data Studio Pro is affordable at $9 per user per month, the platform still requires third-party connectors for non-Google sources like Meta or LinkedIn, which can occasionally introduce latency.
Small to medium enterprises that require a professional PPC agency in Glasgow style report without the overhead of enterprise software.
Microsoft Power BI is the superior choice for organizations requiring deep data modeling and cross-channel attribution. Following the April 2025 price adjustment, Power BI Pro now costs approximately $14 per user per month. It excels at blending PPC data with internal SQL databases or complex CRM systems. The 2026 updates have integrated visual calculations and custom totals, making it easier to build sophisticated financial models directly within the dashboard. However, these tools demand a dedicated data analyst or a strategic partner to manage the underlying architecture. Without expert oversight, the complexity of Power BI can become a barrier rather than an advantage.
For businesses with limited budgets or those requiring highly specific, one-off calculations, Google Sheets remains a viable "quick and dirty" solution. With the 2026 integration of Gemini AI, Sheets can now automate formula creation and data summarization, reducing the manual burden. However, it lacks the real-time synchronization and visual authority of a dedicated ppc reporting dashboard template. For high-growth brands, proprietary agency dashboards often provide the best middle ground, offering the customization of Power BI with the user-friendly interface of Data Studio, ensuring complete transparency in every campaign movement.
Building a professional ppc reporting dashboard template requires a methodological approach to ensure data integrity and strategic utility. The process begins with technical alignment and ends with an automated delivery system that eliminates manual overhead. If your dashboard isn't saving you time, it isn't serving its purpose. Follow these five steps to establish a high-performance reporting framework.
Success must be defined before it can be measured. For growth-oriented brands, this is typically total revenue or qualified lead volume. This metric should sit at the top of your hierarchy.
Verify that your tracking tags, including GA4 and the Meta Pixel, are firing correctly. With the 2026 shift toward link-click only attribution on Meta, ensuring your Conversions API is active is critical for accurate reporting.
Use tools like Supermetrics or Coupler to bridge the gap between platform APIs and your dashboard. Native integrations, such as those in the Google Ads API v24, now support detailed cart-level profit reporting, which should be prioritized for e-commerce.
Layout matters. Place high-level financial KPIs at the top, followed by efficiency metrics, and granular campaign data at the bottom. This ensures stakeholders aren't buried in detail before seeing the bottom-line impact.
Set your data to refresh at least every 24 hours. Automated delivery ensures that stakeholders receive reports before weekly strategy sessions, removing the friction of manual requests.
Data overload is the most frequent mistake in dashboard design. Including too many charts often leads to decision paralysis. You don't need to track every available metric; you only need to track those that influence your Digital Strategy. Broken links are another common failure. Since the Google Ads API moved to a monthly release cycle in early 2026, manual API refreshes have become the enemy of accuracy. Finally, never ignore mobile accessibility. Strategic decisions often happen on the go, and a dashboard that doesn't render properly on a smartphone is a functional failure.
AI has transformed reporting from a backward-looking exercise into a predictive tool. Platforms now use AI to spot anomalies in spend or performance before they become crises. Automated 'Insight Summaries' leverage Gemini or Copilot to explain the 'Why' behind the 'What', saving specialists hours of manual interpretation. Predictive pacing is the future of budget management, using historical and real-time data to forecast end-of-month spend and performance. To ensure your reporting framework is built for this level of scale, consider a bespoke digital strategy to align your data with your long-term business goals.
A professional ppc reporting dashboard template is a powerful asset, yet it represents only 10% of the growth equation. The remaining 90% is defined by methodological execution. Data visualization organizes your reality; strategic interpretation changes it. Many agencies provide reports that simply mirror the past. At Behaviour Digital, we treat data as a diagnostic tool to engineer the future. We move beyond the "what happened" phase to focus exclusively on "how we scale," ensuring that every data point serves a specific commercial objective.
Our approach merges quantitative data from platform APIs with qualitative user behaviour analysis. Numbers tell you that a user clicked; behavioural data explains why they didn't convert. By integrating these insights, we fuel continuous conversion rate optimization efforts that lower your acquisition costs over time. This synergy ensures that your ad spend isn't just being managed; it's being optimized through a rigorous cycle of hypothesis, testing, and refinement. We don't just report on the funnel; we rebuild it for higher efficiency.
Businesses in Glasgow and across the global market choose Behaviour Digital because they require more than a service provider. They need a strategic partner who takes accountability for the bottom line. Our process is designed to identify "hidden" opportunities within your PPC data that automated tools often overlook. This includes spotting cross-channel attribution gaps or identifying high-intent search term clusters that competitors have neglected. In one recent engagement, our data-driven reporting framework and subsequent tactical adjustments led to a documented 40% increase in ROAS for a scaling e-commerce brand. We achieve these results by maintaining a relentless focus on incremental gains that compound into significant business growth.
Transparency is the cornerstone of our monthly management. We provide real-time, interactive dashboards that offer a single source of truth for your digital investment. There are no hidden metrics or "black box" strategies. You see exactly what we see. This level of clarity allows for agile decision-making and fosters a relationship built on measurable success rather than vague promises. If your current reporting feels like a tick-box exercise, it's time for a more sophisticated approach. We offer a bespoke reporting audit to evaluate your current campaigns and identify the structural changes needed to unlock your next phase of growth. Book a strategy session with Behaviour Digital today to transform your data into a definitive competitive advantage.
A professional ppc reporting dashboard template serves as the foundation for every successful campaign in 2026. By transitioning from static reports to automated, real-time environments, you gain the clarity needed to make high-stakes financial decisions with confidence. We've defined the essential KPIs and technical steps required to bridge the gap between raw platform data and measurable business expansion. The goal is no longer just to track spend, but to orchestrate growth through precise, data-backed interventions.
Data is a powerful asset, but its value is only realized through expert execution. As Glasgow-based strategic experts, Behaviour Digital specializes in high-growth PPC and CRO. We include transparent, real-time reporting in all our management fees to ensure our partners always have a single source of truth. Scale your PPC with Behaviour Digital's data-driven strategy and turn your advertising into a predictable engine for revenue. It's time to stop reacting to the market and start leading it.
Data Studio remains the most effective free environment for performance reporting following its April 2026 rebranding. It offers native, no-cost connectors for Google Ads, YouTube, and Google Analytics 4. While the base platform is free, a professional ppc reporting dashboard template often requires third-party connectors to integrate non-Google data like Meta or LinkedIn, which usually carry a monthly subscription fee.
Monitoring frequency should align with your ad spend and campaign complexity. You should check the dashboard daily for budget pacing and to spot performance anomalies before they escalate. Weekly reviews are ideal for tactical adjustments like bid optimizations or creative swaps. Monthly sessions should focus on high-level strategy, long-term growth trends, and total business profitability.
Cross-channel integration is essential for a holistic view of your marketing efficiency. You can blend data from Google and Meta using third-party connectors or by exporting data to a centralized warehouse like BigQuery. This unified approach allows you to calculate your Marketing Efficiency Ratio (MER), which measures total revenue against total ad spend across all platforms.
No, the platform is designed for accessibility with a drag-and-drop interface. Most marketers can build a functional ppc reporting dashboard template using pre-built layouts and native connectors. However, as your data needs grow to include complex cross-channel blending or custom SQL queries, partnering with a strategic expert ensures your data architecture remains accurate and scalable.
PPC dashboards focus on the "pre-click" stage of the funnel, tracking metrics like ad spend, CPC, and creative performance. Google Analytics 4 reports primarily track "post-click" behavior, such as session duration and on-site conversions. A strategic reporting suite merges these datasets to provide a complete view of the user journey from the initial ad impression to the final sale.
Costs vary based on data volume and the number of sources. Data Studio Pro is priced at $9 per user per month for enhanced enterprise features. Third-party connectors like Supermetrics or Coupler typically range from $19 to over $500 per month. These costs are a necessary investment for automating data flow and eliminating the manual errors associated with spreadsheet uploads.
B2B reporting must prioritize lead quality and pipeline impact over vanity metrics. You should track the cost per Marketing Qualified Lead (MQL) and the conversion rate from MQL to Sales Qualified Lead (SQL). Because B2B sales cycles are often long, monitoring the total pipeline value generated by your PPC efforts is critical for justifying your digital strategy to stakeholders.
Discrepancies are usually caused by differing attribution models or data processing lags. For example, Meta's March 2026 update changed click-through attribution to only count link clicks, which might differ from how your dashboard calculates engagement. Other factors include time zone mismatches between platforms and the specific refresh intervals set for your API connectors.

Luke leads strategy across every Behaviour Digital account — building data-driven advertising systems for ambitious brands. When he's not auditing ad accounts, he's writing about what he found in them.
Get a free, tailored growth plan — we'll run our framework on your accounts and show you exactly what we'd do.
Get your free growth plan →