.webp) Online
OnlineNot sure which channel fits your business?View all services →
Three inputs. Instant KPIs. No spreadsheets.Open a calculator →
OnlineIs your 400% return actually generating profit, or is it simply masking a slow drain on your margins? In a 2026 landscape where CPCs have surged by up to 25%, relying on a basic return on ad spend formula without accounting for overhead is a strategic error. Many businesses celebrate a positive dash...

Is your 400% return actually generating profit, or is it simply masking a slow drain on your margins? In a 2026 landscape where CPCs have surged by up to 25%, relying on a basic return on ad spend formula without accounting for overhead is a strategic error. Many businesses celebrate a positive dashboard metric while failing to realize their conversion rates have dropped by nearly 10% year on year. Success in this environment requires more than just basic arithmetic; it demands an analytical understanding of where your money actually goes.
We understand the frustration of seeing high traffic volume that doesn't translate into a healthier bottom line. It's easy to get lost in the distinction between ROAS and ROI or to set unrealistic targets that your PPC agency cannot hit. This guide provides the methodology needed to master the ROAS formula and calculate your precise break-even points. You'll learn the exact data-driven strategies used by Glasgow's top experts to move beyond vanity metrics. We will show you how to integrate conversion rate optimization with your ad spend to ensure every pound invested contributes to sustainable, measurable business growth.
• Master the fundamental return on ad spend formula to move beyond surface-level metrics and accurately track the gross revenue generated by every pound spent.
• Learn how to integrate GA4 data with platform fees and management costs for a mathematically precise view of your total campaign investment.
• Discover the methodology for calculating your unique break-even point to distinguish between high vanity metrics and actual business profitability.
• Identify actionable strategies to improve performance through precise audience refining and creative optimization without increasing your existing ad budget.
• Understand the strategic advantages of partnering with a Glasgow-based PPC expert to navigate the increasing complexity of the 2026 digital landscape.
ROAS is the fundamental metric that dictates the health of your paid media efforts. It represents the gross revenue generated for every single pound allocated to your advertising budget. While other metrics like Click-Through Rate (CTR) or Cost Per Click (CPC) provide tactical insights, the return on ad spend formula offers a high-level view of commercial viability. It acts as the "north star" for businesses in Glasgow and across the UK, providing a clear signal of whether an ad platform is creating value or merely consuming resources.
Distinguishing ROAS from broader financial metrics is essential for accurate reporting. While Return on Investment (ROI) provides a comprehensive look at the profitability of an entire business operation by including overheads, ROAS isolates the performance of the advertising itself. This isolation allows digital strategy experts to evaluate the direct effectiveness of creative assets, targeting parameters, and platform algorithms without the noise of manufacturing, shipping, or logistics costs. It's a diagnostic tool designed to measure marketing efficiency, not total business profit.
The core of this metric is a simple calculation: ROAS equals the gross revenue from an ad campaign divided by the total cost of that campaign. If your business invests £1,000 into a Google Ads campaign and generates £5,000 in tracked sales, your ROAS is 5x, or 500%.
Digital strategy experts typically prefer expressing this as a ratio, such as 5:1. This format is more intuitive for scaling. It tells you exactly how many pounds you get back for every pound you put in. Using the return on ad spend formula consistently across your channels ensures that you aren't comparing "apples to oranges" when evaluating different platforms. It provides a level playing field for every pound in your marketing budget.
The 2026 advertising landscape is defined by rising costs and fragmented attention. You can't afford to guess where your budget is most effective. ROAS allows you to track the efficiency of specific channels like Meta, Google, or LinkedIn with surgical precision.
Data provides the confidence to shift budget from underperforming channels to those with a higher multiplier.
It highlights campaigns that are technically active but are costing more in ad spend than they generate in gross revenue.
Transparent ROAS reporting is the only way to justify increasing monthly ad budgets to stakeholders.
Without a rigorous application of this formula, your PPC management is reactive rather than strategic. In an era where CPCs have risen by up to 25% in certain sectors, the margin for error has disappeared. Precision is the only path to profitability.
Precision in measurement is the difference between scaling a profitable campaign and wasting capital on a deficit. To apply the return on ad spend formula effectively, you must first ensure data integrity. This begins with integrating Google Analytics 4 (GA4) directly with your ad platforms. Without this connection, you risk relying on siloed data that often over-reports success. Reliable reporting requires a unified view where every click is mapped to a specific conversion event.
True cost calculation extends beyond the primary platform invoice. Most businesses make the mistake of only counting the direct spend paid to Google or Meta. To find your actual ROAS, you must include platform fees and professional management costs. If your dashboard shows a 4:1 return but ignores a 15% agency fee, your real-world performance is significantly lower than reported. This level of transparency is a core pillar of professional digital strategy, ensuring that every financial decision is based on net reality rather than vanity metrics.
Calculating ROAS for direct e-commerce is straightforward. You divide total tracked revenue by your total ad investment. For a comprehensive look, consult this guide to calculating ROAS which breaks down these variables in detail. If an e-commerce campaign spends £2,500 and generates £10,000 in sales, the ROAS is 4.0 or 400%.
Lead generation requires a more nuanced return on ad spend formula. You must first determine your Lead Value by multiplying your average close rate by your average order value. If your close rate is 10% and a typical deal is worth £5,000, each lead is worth £500. If you spend £5,000 to acquire 20 leads, your attributed revenue is £10,000, resulting in a 2:1 ROAS. Failing to define these values leads to "flying blind" in your PPC management.
Over-attribution is a frequent error in 2026 marketing funnels. When multiple channels claim credit for a single sale, your aggregate ROAS will appear inflated. You must also account for the "halo effect," where paid ads drive direct or organic traffic that doesn't immediately show up in platform reporting. Conversely, failing to deduct product returns or order cancellations from your revenue data will lead to a false sense of security. Clean data is not an option; it is a requirement for growth.
The industry standard of a 4:1 ratio is a dangerous oversimplification. Many businesses blindly chase this benchmark without realizing that their specific financial structure might require a much higher multiplier to stay solvent. A 400% return is meaningless if your margins are so thin that every sale results in a net loss after accounting for fulfillment and overhead. Your target shouldn't be based on a generic industry average; it must be dictated by your unique unit economics.
To determine your true floor, you must utilize the break-even return on ad spend formula. This calculation is straightforward: 1 divided by your contribution margin percentage. For example, a business with a 25% contribution margin has a break-even ROAS of 4.0. If that same business sees their ROAS dip to 3.8, they're effectively paying for the privilege of shipping products. Conversely, a high-margin enterprise with a 70% margin has a break-even point of roughly 1.4, allowing them to bid more aggressively and capture market share that competitors simply can't afford.
Calculating your minimum viable return requires three specific steps. First, calculate your gross margin by subtracting the Cost of Goods Sold (COGS) from your total revenue. Second, determine your contribution margin percentage by subtracting variable costs like shipping and payment processing from that gross margin. Finally, apply the 1/Margin formula to identify your absolute floor. Any campaign performing below this number is actively destroying capital. Knowledge of this floor allows for decisive, data-backed management of your digital strategy.
Sophisticated advertisers in 2026 are increasingly moving away from top-line revenue tracking in favor of Profit on Ad Spend (POAS). While the return on ad spend formula measures what you make, POAS measures what you keep. This shift is transformative for bidding strategies in Google Ads. By integrating real-time profit data into your ad platforms, you can optimize for net gain rather than gross volume. This ensures your budget is automatically funneled toward the products or services that contribute most to your bottom line, regardless of their individual price points. In a high-cost environment, net profit is the only metric that guarantees long-term sustainability.
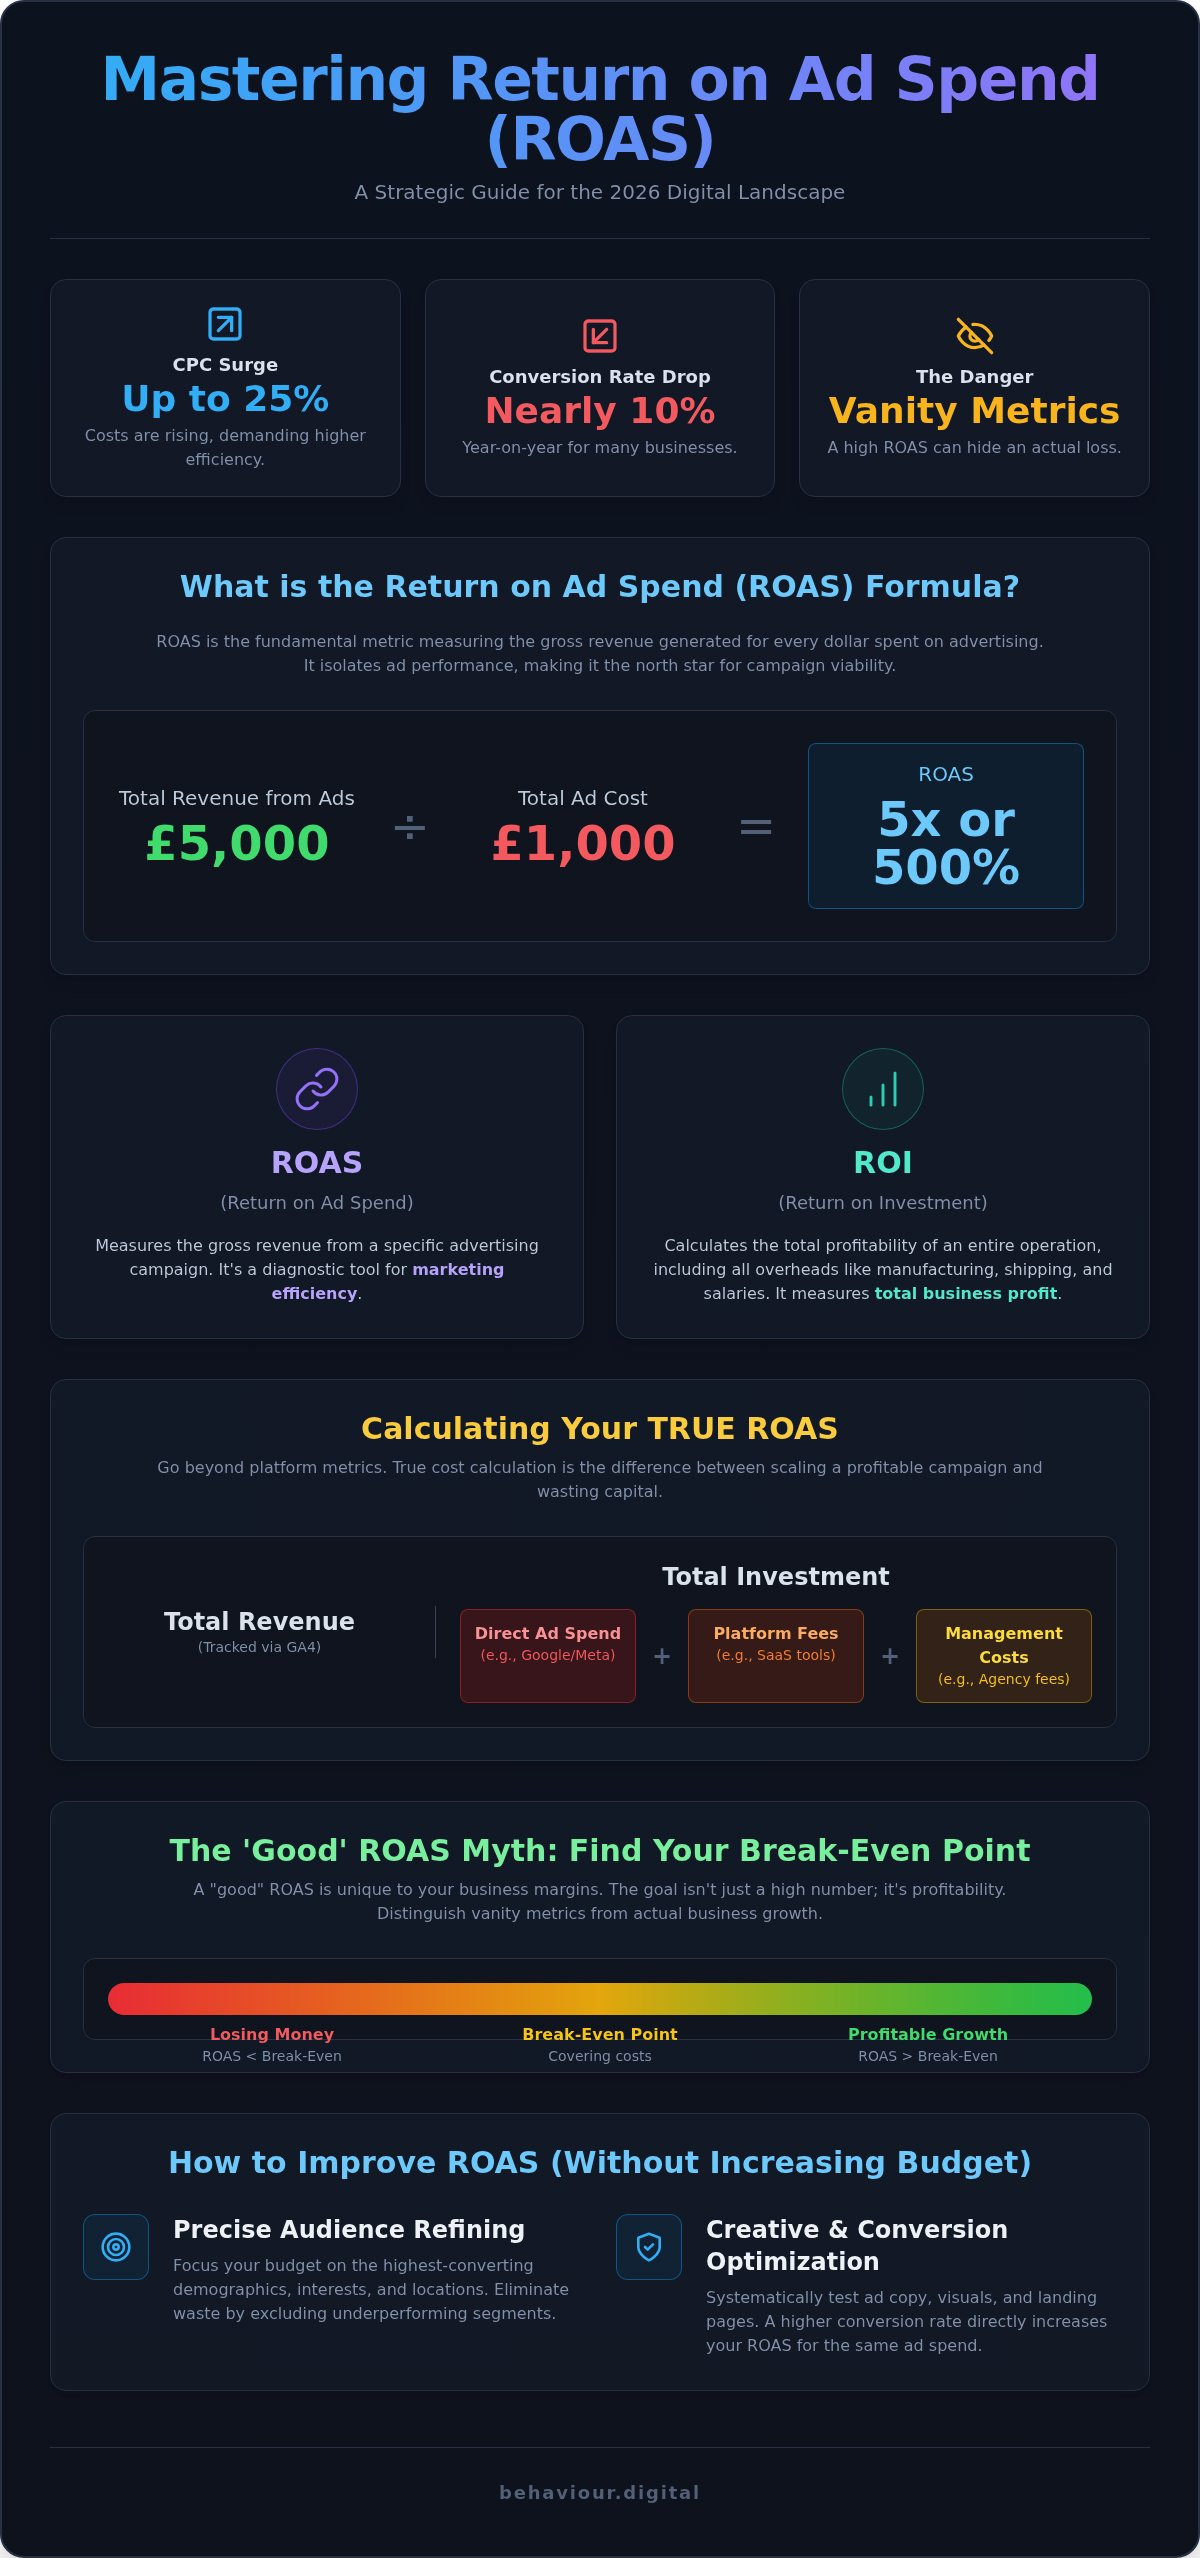
Maximising efficiency requires looking at the variables within the return on ad spend formula rather than just the total investment. In 2026, where CPCs have risen by up to 25% across most industries, you can't rely on brute force spending to hit your targets. Improvement comes from surgical refinement of your audience targeting and the elimination of "waste" spend. By leveraging negative keywords and excluding demographics that don't convert, you ensure your capital is only deployed where it has the highest probability of return.
High-performing ad creative is your most effective lever for lowering costs. When your click-through rate (CTR) increases, platform algorithms perceive your ads as more relevant to the user. This relevance is a core component of your Quality Score. A higher Quality Score directly reduces the amount you pay per click, effectively allowing you to buy more traffic for the same budget. Continuous A/B testing of imagery and copy isn't a luxury; it's a fundamental requirement for maintaining a competitive edge. If you want to stop overpaying for traffic, you should audit your current PPC performance to identify these hidden inefficiencies.
The website is often the weakest link in the return on ad spend formula. You can have the most efficient ads in the world, but if your landing page is slow or confusing, your ROAS will suffer. In fact, a 1% increase in conversion rate can effectively double your return. Focusing on conversion rate optimisation allows you to extract more value from the traffic you already have. This involves fixing friction points like slow load speeds, complex checkout flows, or misaligned messaging that fails to deliver on the ad's promise.
Automated bidding strategies, such as Target ROAS, are powerful tools when fed with high-quality data. However, they aren't "set and forget" solutions. These algorithms require a steady stream of conversion data to function correctly. By improving your Quality Score through better ad-to-page relevance, you lower your CPC and give the automated bidder more room to manoeuvre. This synergy between technical bid management and creative excellence is what separates profitable brands from those struggling with declining conversion rates, which have fallen by an average of 9.28% this year.
Managing the return on ad spend formula in-house has become a significant challenge as we progress through 2026. The digital environment is more fragmented than ever. For the first time in two decades, Google's share of search ad spending has fallen below 50%. Simultaneously, AI Overviews have reduced paid ad click-through rates by up to 68% on affected queries. These shifts mean that a "set and forget" approach to PPC is no longer viable. Success now requires constant, high-level technical adjustment that most internal teams simply don't have the bandwidth to maintain.
Partnering with a PPC agency in Glasgow offers a distinct strategic advantage. We combine local market insights with a deep understanding of global platform shifts. At Behaviour Digital, we utilize a proprietary 'Growth Framework' that moves beyond basic arithmetic. We treat the return on ad spend formula as a diagnostic starting point, using it to identify deeper opportunities in user behaviour and conversion paths. Our focus remains on measurable business evolution, ensuring that your ad spend is an investment in growth rather than a recurring expense.
Transparency is the cornerstone of our partnership. You'll never receive reports filled with vanity metrics or marketing jargon. We provide clear, monthly reporting that highlights the actual business value generated by your campaigns. We track the metrics that matter: net profit, customer acquisition cost, and contribution margins. This data-driven clarity allows you to see exactly how your budget translates into tangible revenue, providing the professional predictability required for scaling.
We don't believe in siloed marketing. To achieve a superior ROAS in 2026, you must integrate PPC, Social Media Marketing, and Conversion Rate Optimization into a single, cohesive engine. By aligning your paid search intent with a high-performance landing page, you eliminate the friction that causes conversion rates to drop. We've seen this integrated approach transform local retailers by focusing on the quality of the user journey. Our methodology is result-oriented and entirely free of the fluff often found in traditional agency models.
The first step toward scaling is identifying where your current strategy is failing. Many accounts are currently losing capital through poor attribution models or outdated bidding strategies. A professional audit can uncover these hidden inefficiencies and provide a clear roadmap for improvement. Now is the time to move away from guesswork and toward a strategy rooted in quantitative data. Contact Behaviour Digital for a data-driven PPC audit and ensure your marketing budget is optimized for the realities of the 2026 landscape.
Achieving sustainable growth in 2026 requires a shift from passive observation to active, data-driven management. You've learned that the return on ad spend formula is a diagnostic starting point, not a final verdict on your marketing success. By calculating your precise break-even points and integrating conversion rate optimization, you move beyond vanity metrics and focus on net business value. In a landscape where costs are rising, precision is your only competitive advantage.
Success isn't found in a single calculation; it's the result of continuous methodology refinement. As a Glasgow-based strategic partner, Behaviour Digital specializes in the synergy between high-performance PPC and CRO. Our result-oriented methodology ensures that every pound spent is optimized for maximum impact. It's time to stop guessing and start scaling with a partner who understands both the local and global landscape. Maximize your ad profitability with a Glasgow PPC expert and take control of your campaign performance today. Your next level of growth is waiting.
A good ROAS is relative to your specific profit margins, but the median for Google Ads in 2026 is 3.31x. While a 4:1 ratio is often cited as a benchmark, the cross-industry average has declined to 2.87:1. You must calculate your specific break-even point to define "good" for your business. High-margin sectors can thrive at lower ratios, while low-margin retail may require a 5:1 return to remain viable.
No, ROAS cannot be mathematically negative because revenue and ad spend are always positive values. However, your net profit resulting from that ROAS can certainly be negative. If your return on ad spend formula results in a figure below your break-even point, you're effectively losing money on every transaction. A positive ROAS on a dashboard doesn't guarantee that the campaign is contributing to business growth.
You calculate ROAS by assigning a specific lead value based on your offline conversion data. Multiply your average lead-to-sale close rate by your average contract value to determine what a single lead is worth to the business. If your close rate is 10% on £5,000 deals, each lead is worth £500. Use this assigned value as your "revenue" when applying the standard calculation.
ROAS measures gross revenue per pound spent specifically on advertising, while ROI accounts for all business expenses, including COGS, shipping, and salaries. ROAS is a diagnostic tool used to measure marketing efficiency and channel performance. ROI is the final verdict on the total profitability of the business operation. You can have a high ROAS and still have a negative ROI if your overheads are too high.
Attribution modeling dictates which touchpoint receives credit for a sale, which directly changes the revenue variable in your return on ad spend formula. A data-driven model distributes credit across multiple ads, whereas a last-click model gives 100% to the final interaction. Choosing the wrong model can lead to over-valuing certain channels and under-funding others, resulting in skewed performance data and poor budget allocation.
Not necessarily, as an exceptionally high ROAS often indicates that you're under-spending and leaving potential market share on the table. Rapid scaling usually involves a temporary dip in ROAS to capture more volume. The ultimate goal is to maximize total net profit. This often requires accepting a lower, yet still profitable, ROAS to drive significantly higher sales volume and dominate your market segment.
You should monitor ROAS daily for tactical anomalies, but perform strategic reviews on a weekly or monthly basis. Advertising platforms require time to exit the learning phase and collect statistically significant data. Reviewing too frequently can lead to knee-jerk reactions that disrupt the algorithm's optimization process. Focus on long-term trends rather than daily fluctuations to make informed, data-backed adjustments to your digital strategy.
You must immediately audit your campaign's technical health and creative relevance. Start by excluding non-performing keywords and refining audience segments to stop budget leakage. If the ads are driving traffic but not sales, shift your focus to conversion rate optimization. Fixing friction points on your landing pages is often more effective than simply changing ad copy when your return falls below the floor of profitability.

Luke leads strategy across every Behaviour Digital account — building data-driven advertising systems for ambitious brands. When he's not auditing ad accounts, he's writing about what he found in them.
Get a free, tailored growth plan — we'll run our framework on your accounts and show you exactly what we'd do.
Get your free growth plan →