.webp) Online
OnlineNot sure which channel fits your business?View all services →
Three inputs. Instant KPIs. No spreadsheets.Open a calculator →
OnlineCompanies that invest in social media monitoring see an average 10.2% year-over-year revenue increase, yet many agencies still fail to bridge the gap between a like and a lead. You've likely felt the weight of manual data entry while knowing your client only cares about the bottom line. It's difficu...

Companies that invest in social media monitoring see an average 10.2% year-over-year revenue increase, yet many agencies still fail to bridge the gap between a like and a lead. You've likely felt the weight of manual data entry while knowing your client only cares about the bottom line. It's difficult to justify a strategy when vanity metrics don't clearly translate to bankable results. Effective social media reporting for clients isn't about a data dump; it's a strategic narrative that connects platform activity to actual revenue.
You'll learn how to transform raw social data into high-impact business insights that prove ROI and drive strategic decisions. We'll cover how to navigate 2026's AI-driven recommendation models and the shift toward dwell time as a primary ranking signal. This guide provides a clear framework for building reports that satisfy both algorithm requirements and strict new consumer privacy laws. From understanding interest graphs to optimizing for the latest platform updates, you're about to turn your reporting from a chore into a powerful growth engine.
• Identify why traditional engagement metrics fail to satisfy clients and how to bridge the reporting gap with ROI-focused data.
• Adopt a 2026 framework for social media reporting for clients that prioritizes Share of Voice, brand sentiment, and lead quality.
• Master the "So What?" factor by structuring data into a narrative arc that connects social activity to business outcomes.
• Establish a professional reporting workflow by auditing tracking parameters and defining North Star metrics prior to campaign launch.
• Transition from manual data entry to strategic analysis to transform raw numbers into a measurable competitive advantage.
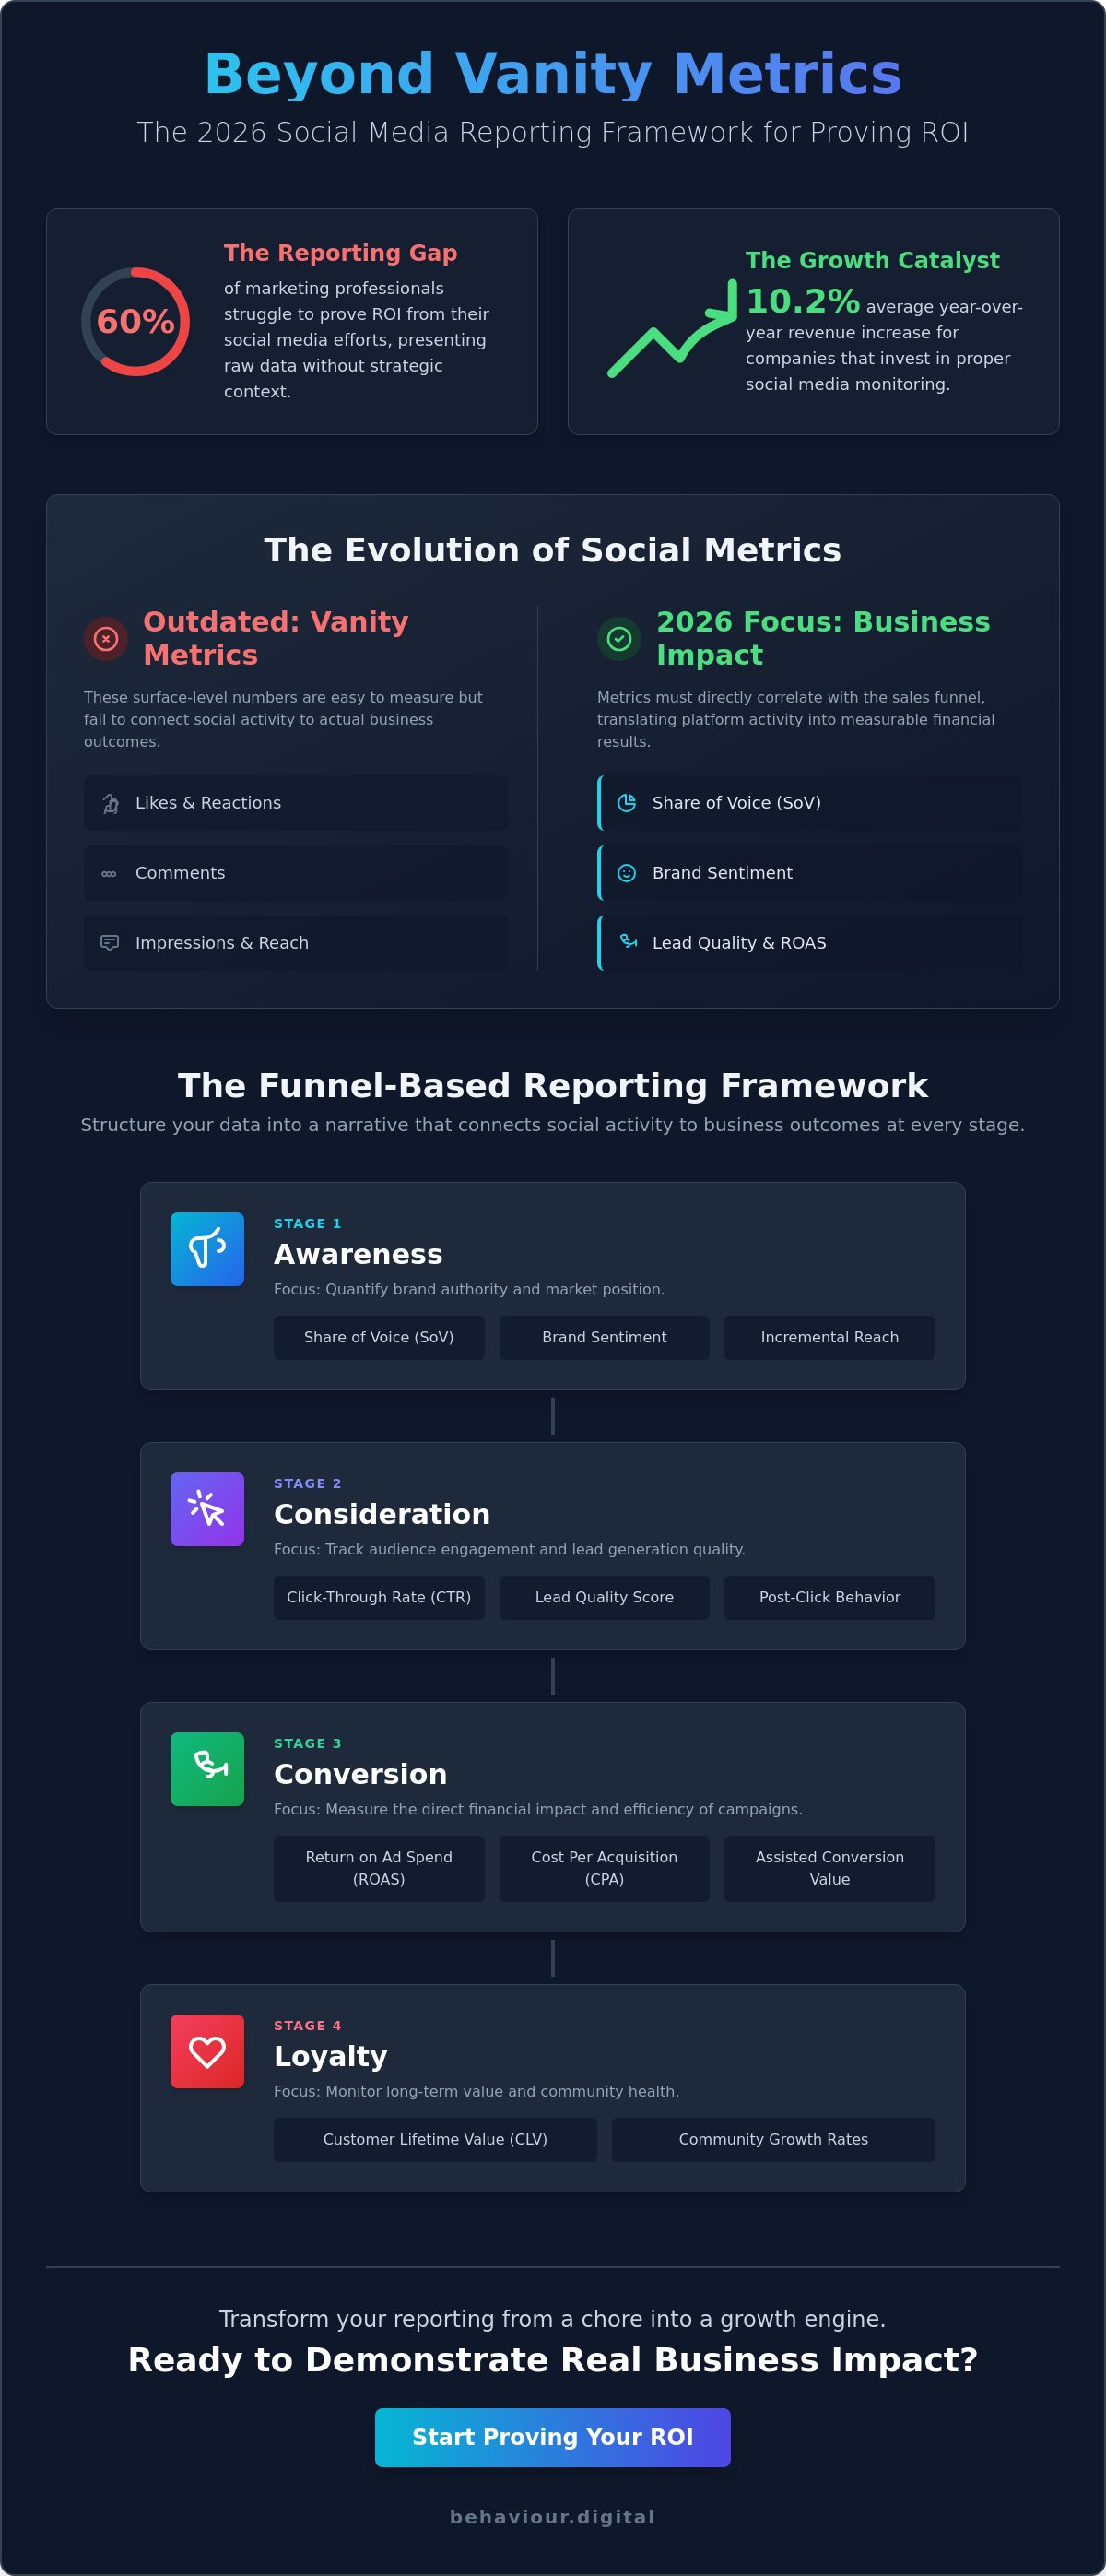
The era of chasing "Likes" as a primary KPI ended years ago. In 2026, social platforms operate on complex interest graphs, making surface-level engagement a poor indicator of commercial success. High-performing agencies understand that social media reporting for clients must move beyond simple tallies of hearts and shares. While 89% of marketers use some form of monitoring, a significant reporting gap remains. Roughly 60% of professionals still struggle to prove ROI, even with access to more granular data than ever before. This gap exists because raw data is often presented without a logical link to the client's commercial objectives.
Success requires a shift from descriptive reporting to prescriptive analysis. It's not enough to say what happened; you must explain why it happened and what the next strategic move should be. This transition is a core component of a modern Digital Strategy. By providing clear, actionable insights, you build the kind of trust that reduces client churn and positions your agency as a long-term partner. When you bridge the gap between data and strategy, you stop being a service provider and start being a strategic advisor.
Many agencies rely on "one-click" exports from popular tools. These reports often fail because they lack context and prioritize what is easy to measure over what is important to the client's bottom line. This leads to data overload, where clients are buried under dozens of irrelevant charts that obscure actual performance. Effective social media reporting for clients involves stripping away the noise. If a metric doesn't influence a decision or reflect a specific business goal, it doesn't belong in the report. Using social media analytics correctly means filtering raw data into a narrative that supports growth, not just filling pages with colorful but meaningless graphics.
C-suite stakeholders don't speak the language of "reach" or "impressions." They speak the language of revenue, customer acquisition cost, and lifetime value. Your reporting must translate social activity into these business terms. This alignment starts at the top of the Social Media Marketing funnel and continues through to conversion. The most critical element is the Executive Summary. This section should distill the entire month's activity into three to five bullet points that highlight wins, losses, and specific recommendations. A well-crafted summary allows stakeholders to grasp the return on their investment in seconds. It provides the "so what" that justifies continued spend and strategic pivots, ensuring that even the busiest executive understands the value your work provides.
A data dump is not a strategy. To provide a professional level of social media reporting for clients, you must categorize metrics by their impact on the sales funnel. This methodology ensures that every chart serves a specific business purpose. We divide performance into four distinct pillars: Awareness, Consideration, Conversion, and Loyalty. This structure allows stakeholders to see exactly where the budget is driving growth and where the strategy requires methodology refinement.
Focus on Share of Voice (SoV), Brand Sentiment, and Incremental Reach.
Track Click-Through Rate (CTR), Lead Quality, and Post-Click Behavior.
Measure ROAS, Cost Per Acquisition (CPA), and Assisted Conversion Value.
Monitor Customer Lifetime Value (CLV) and community growth rates.
Extracting business intelligence from social media allows us to quantify brand authority through sentiment analysis and competitive context. This high-level view is essential for long-term planning, but it's only half the story. You also need to demonstrate how these top-of-funnel activities eventually lead to the bottom line. Tracking the transition from a casual viewer to a qualified lead is where true strategic value is proven.
In 2026, reach is a vanity metric unless it targets the right interest graph. We prioritize "High-Quality Impression" data, which measures how effectively content reached the intended audience segment. For instance, data shows that Instagram Reels achieve 36% more reach than carousels on average, making them ideal for awareness. However, carousels receive 12% more engagement, which is better for building authority. By pairing reach with social listening, you provide clients with competitive context that automated tools often miss. This approach turns simple numbers into a narrative about market share and brand health.
Direct revenue is the ultimate proof of value. Modern attribution modeling has moved beyond simplistic last-click methods to multi-touch systems. This change acknowledges that a customer might see a Reel, engage with a carousel, and then convert days later via a retargeting ad. Integrating conversion rate optimization data is critical here. It explains why a user clicked but didn't buy, allowing for precise tactical adjustments. To calculate true Social ROI, we use a formula that includes both direct sales and assisted conversion value. If you want to see how this data-driven approach can scale your brand, explore our Social Media Marketing services.
Raw data is static. A professional report is dynamic. To master social media reporting for clients, you must build a narrative arc that leads from a business problem to a data-backed solution. If engagement on Instagram declined by 26% over the last two years, your report shouldn't just state the drop. It should identify the cause, such as the platform's shift toward interest-based AI feeds, and propose a specific strategic pivot. Every chart must lead the client toward a logical conclusion about their investment.
Data visualization is the bridge between complexity and clarity. Choose your visuals with precision. Use line graphs for tracking 5-second dwell times on LinkedIn and bar charts for comparing Share of Voice against competitors. Every visual must pass the "So What?" test. If a chart doesn't have a written insight explaining its impact on revenue or brand authority, it shouldn't be there. This rigorous approach separates a meaningful guide to social media analytics from standard agency noise.
Balance your timelines for maximum clarity. Use Month-on-Month (MoM) comparisons for tactical agility, such as testing new AI-assisted content tools or human-speech Reels. Use Year-on-Year (YoY) data to account for seasonality and to measure long-term brand health. For a truly holistic view, integrate your social data with PPC Management metrics. High-performing organic content often serves as the best testing ground for paid creative, and combining these data sets allows you to see how social interactions lower your blended Customer Acquisition Cost.
One report does not fit all stakeholders. Your CEO needs a high-level summary focusing on ROAS, market share, and bottom-line growth. They don't need the specific hook rate of a single Reel. Conversely, your marketing manager needs tactical details like campaign-specific CTR and lead quality. Finally, provide the creative team with format-specific data. Show them exactly which visual hooks held attention for more than 5 seconds. This segmentation ensures every stakeholder receives the specific intelligence they need to act without being overwhelmed by irrelevant noise.
Quantitative data tells you what happened, but qualitative data tells you why. Include "Customer Voice" sections that feature direct comments or sentiment shifts. This provides a human layer to the numbers. Reporting on failed experiments is equally vital. If a specific creative format failed to convert, document what we learned and how it informs the next iteration. In the UK and Scottish markets, connecting these social trends to broader economic shifts provides the strategic depth that clients expect from a partner, not just a vendor.
High-impact social media reporting for clients requires a standardized, repeatable process. Without a clear workflow, data collection becomes a time-consuming burden rather than a strategic asset. A professional workflow ensures that data integrity is maintained from the first click to the final presentation. This systematic approach allows you to spend less time on manual entry and more time on high-level analysis that drives revenue. Every step in this process must be designed to eliminate ambiguity and provide the client with a clear roadmap for growth.
Ensure the Meta Pixel and LinkedIn Insight Tag are firing correctly across all conversion points.
These are the primary indicators of success identified before the campaign starts, such as CPA or Assisted Conversion Value.
Combine automated dashboards for real-time visibility with manual overlays for strategic depth.
Use weekly pulse checks for tactical adjustments and monthly deep-dives for long-term strategic reviews.
Turn report insights into next month’s strategy by identifying which creative experiments should be scaled or cut.
In the post-cookie environment of 2026, server-side tracking is no longer optional. It's the only way to ensure accurate attribution across platforms while complying with the latest data privacy regulations. Standardizing your naming conventions for campaigns is equally vital. Clean data extraction depends on a logical, consistent structure that prevents "noise" from polluting your analysis. Regularly verifying data integrity helps you spot discrepancies before they reach the client's inbox. If your current setup feels fragmented, our team can help you build a cohesive Social Media Marketing infrastructure that prioritizes accuracy.
Efficiency comes from automating the mundane. Tools like Looker Studio or AgencyAnalytics provide real-time dashboards that clients can access at any time. However, automation is not a replacement for expertise. You should never send an automated link without a recorded video or a written executive summary. This personal touch provides the "why" behind the numbers. Professional agencies allocate specific time for "Strategic Analysis" within their monthly service fees. This ensures that social media reporting for clients isn't just a look back at past performance, but a forward-looking roadmap for future business development.
Behaviour Digital operates at the intersection of quantitative analysis and creative strategy. Based in Glasgow, we provide businesses with a global, data-driven mindset that prioritizes commercial outcomes over vanity metrics. We understand that social media reporting for clients must be a transparent, real-time process rather than a static monthly document. Our approach ensures that every pound spent on social platforms is tracked, analyzed, and optimized for maximum impact. By positioning ourselves as a strategic partner, we take full responsibility for the growth trajectories we map out with our clients.
Our social media marketing management Scotland services are built on the principle of behavioral growth. We don't just report on what happened; we explain the psychological triggers that drove user action. This level of insight allows us to integrate social data into your broader business strategy. We ensure that social media isn't an isolated silo but a primary engine for customer acquisition. Transparency is a core value here. You get real-time access to your campaign performance, ensuring total alignment between our team and your internal stakeholders.
We eliminate the "noise" metrics that often clutter agency reports. Our focus remains strictly on the data points that influence your bottom line. During the first 90 days of a partnership, we prioritize establishing a rock-solid technical foundation. This includes server-side tracking and the definition of North Star metrics that align with your specific commercial goals. Our methodology has proven effective across diverse sectors. By identifying a shift in user dwell time and pivoting content strategy accordingly, we helped a client achieve a 40% increase in ROAS within a single quarter. This wasn't the result of luck. It was the result of continuous methodological fine-tuning and a refusal to accept surface-level data as success.
Scaling in 2026 requires a partner that values data as much as creative execution. The complexity of AI-driven algorithms and shifting privacy laws means that "good enough" reporting is a liability. You need a partner that provides professional predictability. Our Glasgow-based experts are ready to conduct a comprehensive social media audit to identify gaps in your current tracking and strategy. This audit serves as the baseline for a growth-focused partnership. If you're ready to transform your data into a strategic advantage, book a strategy call with our Glasgow experts today. We'll show you exactly how our social media reporting for clients can turn your social presence into a measurable revenue stream.
The landscape of 2026 demands more than just automated exports. Success requires a definitive shift from tracking simple engagements to interpreting complex interest graphs and dwell times. By implementing a structured framework and rigorous technical tracking, you bridge the gap between raw data and sustainable business growth. High-impact social media reporting for clients is no longer a retrospective task; it's the foundation of a proactive strategy that drives measurable ROI.
Our Glasgow-based strategic experts specialize in results-driven PPC and Social management. We provide the transparent, data-led reporting necessary to navigate modern algorithm updates and privacy regulations with complete confidence. Every insight we deliver is designed to refine your methodology and maximize your competitive advantage. Stop guessing and start growing—get a professional social media strategy from Behaviour Digital.
Your data holds the roadmap to your next major breakthrough. It's time to let those insights lead the way toward a more profitable and predictable future.
A comprehensive report must include an executive summary, funnel-aligned KPIs, and prescriptive analysis. You should categorize metrics by awareness, consideration, and conversion to show how social activity drives business growth. High-quality social media reporting for clients also includes qualitative data, such as customer sentiment and creative experiment results. This ensures stakeholders understand the "why" behind the numbers rather than just seeing a list of vanity metrics.
Monthly deep-dive reports are the industry standard for strategic reviews. However, providing real-time access through automated dashboards allows for constant transparency. You should supplement these with weekly pulse checks to discuss tactical adjustments and creative performance. This dual cadence ensures that the client feels informed about short-term wins while staying focused on long-term revenue goals and year-over-year growth targets.
Professional social media reporting for clients often utilizes a mix of specialized platforms and custom dashboards. Mid-tier tools like Hootsuite start at $99 per month, while enterprise suites like Sprout Social begin around $249 per user. For agencies requiring deeper customization, Looker Studio remains a primary choice for integrating social data with PPC and CRM metrics. Choosing the right stack depends on your client's specific technical requirements and budget.
Address the drop directly by citing broader platform trends and algorithm shifts. For example, Instagram engagement has declined by 26% over the last two years as the platform shifted toward interest-based AI feeds. Shift the conversation from total likes to "High-Quality Impressions" and dwell time. Explain how your strategy is evolving to prioritize content that earns distribution through transformer-based recommendation models rather than relying on follower counts.
Reach represents the number of unique individuals who saw your content, while impressions count the total number of times it was displayed. In a professional report, reach is a better indicator of brand awareness and market penetration. Impressions are useful for understanding frequency and brand recall. You should prioritize reach when measuring the success of Reels or top-of-funnel campaigns designed to find new audience segments.
Focus on lead quality and assisted conversion value rather than direct e-commerce sales. On platforms like LinkedIn, track "dwell time" as a primary ranking signal; posts that hold attention for 5 seconds or more receive significantly more reach. Show how social interactions nurture prospects through the funnel before they convert on your website. Use multi-touch attribution to prove that social touchpoints played a critical role in high-value contract wins.
Including competitor data is essential for providing market context. Track metrics like Share of Voice (SoV) and brand sentiment to show where the client stands in relation to their primary rivals. This competitive intelligence helps justify strategic pivots and identifies gaps in the competitor's content strategy. It transforms a standard report into a strategic document that helps the client protect and grow their market share in Scotland and beyond.
Strip away the technical jargon and focus exclusively on high-level ROI and bottom-line growth. A CEO cares about how social media affects customer acquisition costs and revenue, not the specific hashtag performance of a post. Use clear visualizations that highlight year-over-year progress and market share. Keep the summary concise, focusing on three to five key insights that demonstrate how your digital strategy is meeting the company's overarching business objectives.

Luke leads strategy across every Behaviour Digital account — building data-driven advertising systems for ambitious brands. When he's not auditing ad accounts, he's writing about what he found in them.
Get a free, tailored growth plan — we'll run our framework on your accounts and show you exactly what we'd do.
Get your free growth plan →