If your store is converting at 2%, you might believe you're hitting the industry standard; however, in 2026, that figure often means you're trailing the top 20% of your niche by a significant margin. Understanding what is a good conversion rate for ecommerce isn't about chasing a single, static numb...
Content
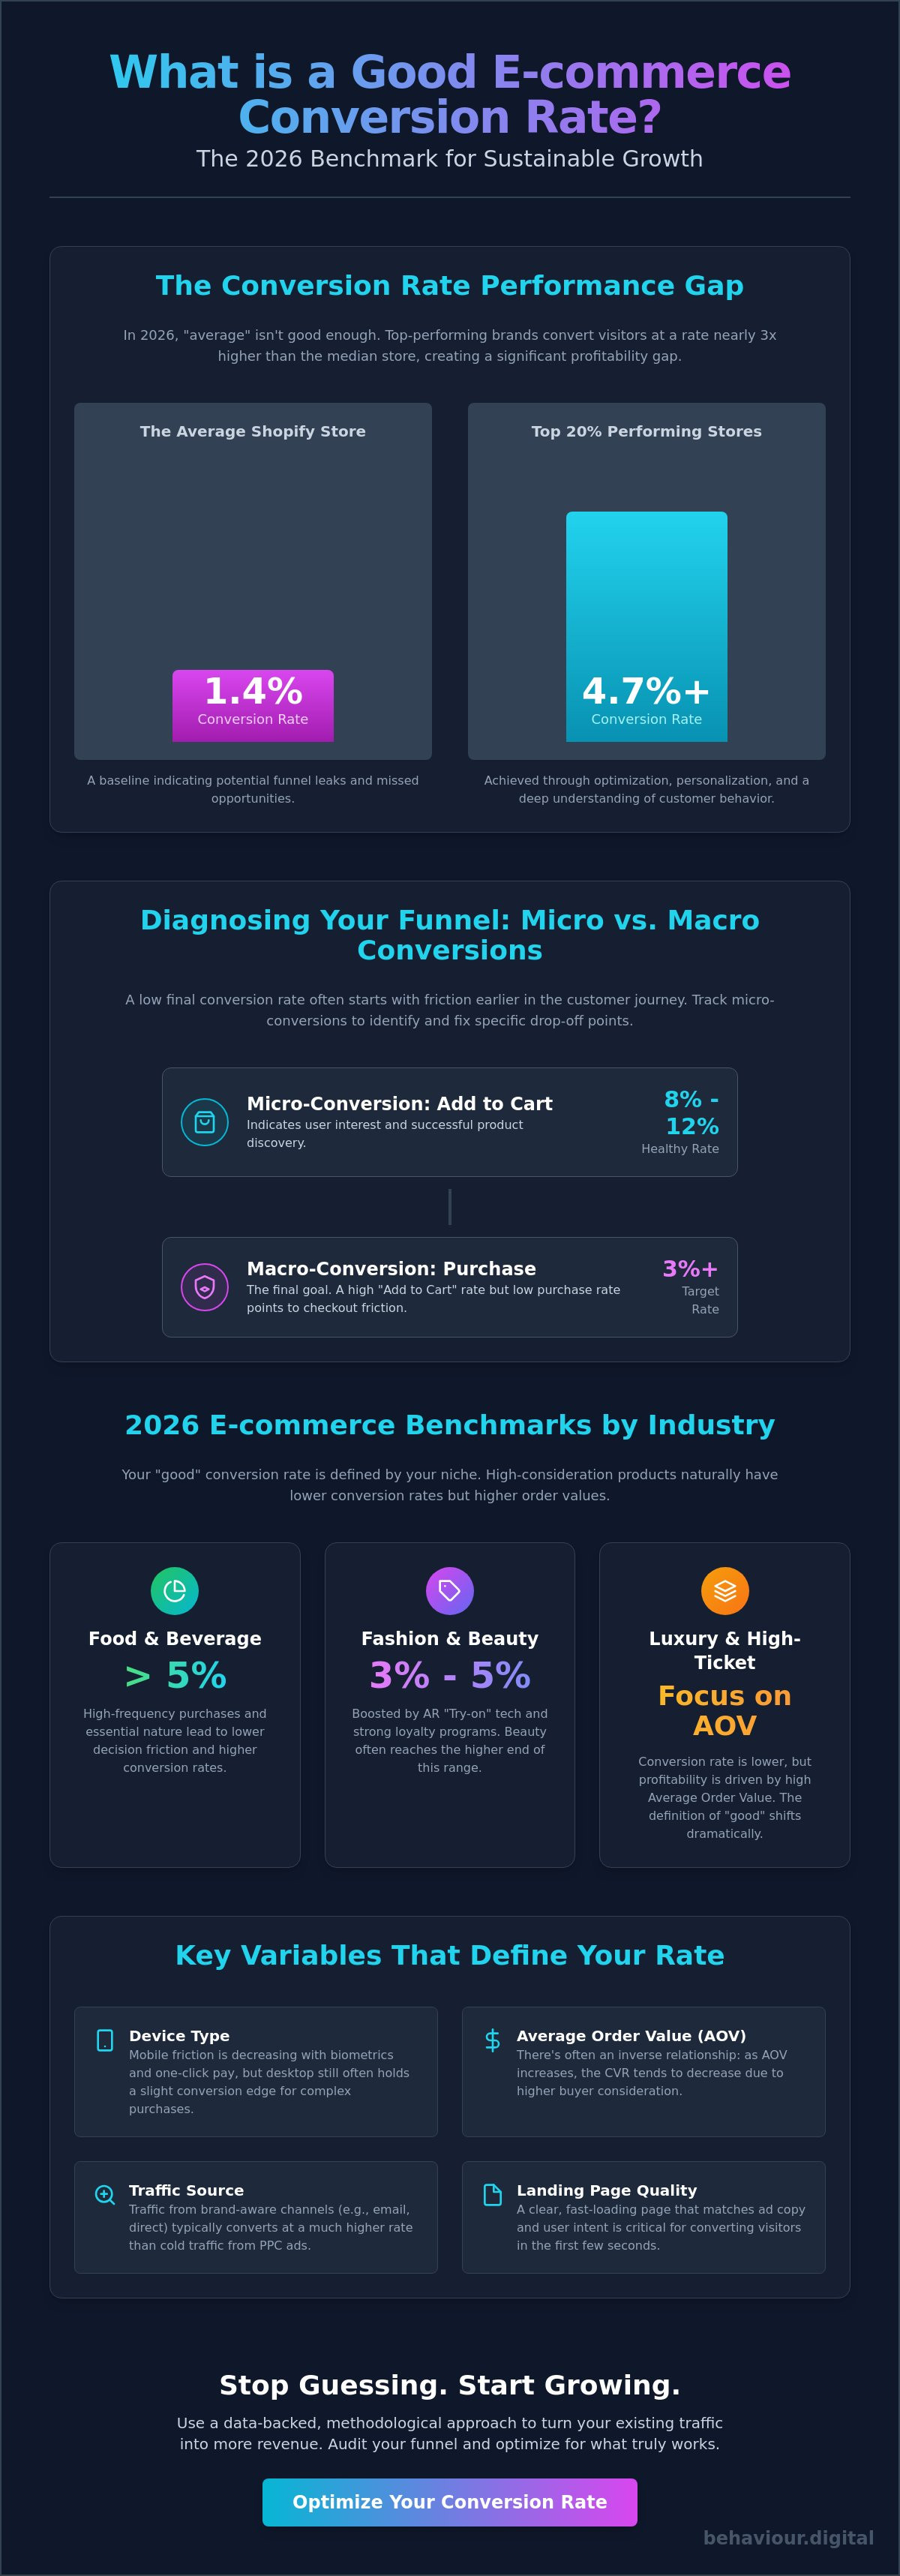
If your store is converting at 2%, you might believe you're hitting the industry standard; however, in 2026, that figure often means you're trailing the top 20% of your niche by a significant margin. Understanding what is a good conversion rate for ecommerce isn't about chasing a single, static number. It's about recognizing that a 1.4% average for Shopify stores is merely a baseline, while the top performers are consistently hitting 4.7% or higher. You've likely experienced the frustration of increasing your PPC spend only to watch your sales volume stagnate while your acquisition costs soar.
We've analyzed the latest June 2026 data to help you move past conflicting benchmarks and gut feelings. You'll discover the specific metrics that define success for your business model and learn how to determine if your current performance is driving sustainable growth or quietly stalling your progress. We'll examine the critical role of checkout completion rates and how AI-driven recommendations are shifting the goalposts for modern brands. This framework provides the clarity you need to stop wasting ad spend and start plugging the leaks in your digital sales funnel.
Key Takeaways
• Define what is a good conversion rate for ecommerce by benchmarking against industry-specific data rather than misleading global averages.
• Understand the inverse relationship between Average Order Value (AOV) and conversion volume to prioritize bottom-line profitability over vanity metrics.
• Identify and repair funnel leaks by segmenting your performance data by device, traffic source, and landing page quality.
• Leverage behavioral science to minimize cognitive load, streamlining your site navigation to convert intuitive shopper intent into confirmed sales.
• Apply a methodology for continuous optimization using GA4 to ensure your digital strategy remains competitive in the 2026 market.
Defining a Good E-commerce Conversion Rate in 2026
E-commerce conversion rate (CVR) represents the percentage of total website visitors who successfully complete a purchase. It serves as the ultimate measure of your digital storefront's operational efficiency. In 2026, the baseline for what is a good conversion rate for ecommerce has evolved significantly. Mobile checkout experiences are no longer a bottleneck; biometric authentication and one-click payments have removed the traditional friction that once suppressed mobile performance. Aiming for an "average" performance is a dangerous strategy. In a hyper-competitive market, average often indicates a business that's barely breaking even on customer acquisition costs.
Success depends on methodological precision. This process of systematic improvement, known as Conversion rate optimization, focuses on turning existing traffic into revenue through data-backed adjustments. High-growth brands don't settle for the middle of the pack. They treat conversion as a dynamic variable that requires constant fine-tuning to stay ahead of rising ad costs and shifting consumer expectations.
The 2026 Benchmark: What the Data Shows
Current global averages hover between 2.5% and 3.2% across most developed markets. This slight increase from previous years is largely driven by AI-powered product recommendations that create hyper-personalized shopping paths. When a site anticipates user intent with 90% accuracy, the likelihood of a transaction increases exponentially. However, 2026 privacy regulations in the post-cookie era have made measurement more complex. Precise attribution now requires server-side tracking and first-party data strategies to maintain a clear view of what is a good conversion rate for ecommerce within your specific niche. Brands that rely on outdated browser-based tracking are likely underreporting their true performance by as much as 15%.
Micro vs. Macro Conversions
A healthy final CVR is always preceded by strong micro-conversions. These are the leading indicators that signal whether your funnel is functioning or failing. "Add to Cart" rates and email sign-ups provide the quantitative evidence needed to diagnose drop-off points. A healthy top-of-funnel typically sees an "Add to Cart" rate between 8% and 12%. If your final purchase rate is low but your cart additions are high, the friction exists in your shipping costs, payment options, or checkout speed. Using this micro-data allows you to identify exactly where users lose momentum before the final transaction. It's a surgical approach to growth that prioritizes measurable business development over guesswork.
E-commerce Conversion Benchmarks by Industry
Global averages provide a necessary baseline, but they rarely offer the strategic depth required to audit a specific business model. When asking what is a good conversion rate for ecommerce, you must first categorize your brand by purchase frequency and price point. High-frequency sectors like Food and Beverage often see conversion rates exceeding 5% due to the essential nature of the products and lower decision-making friction. Conversely, industries with high average order values (AOV) operate on entirely different mathematical principles. Your niche dictates the upper ceiling of your conversion potential, and fighting against these structural realities leads to inefficient resource allocation.
In June 2026, the performance gap between top-tier brands and the median has widened significantly. While the average Shopify store maintains a 1.4% conversion rate, the top 20% of brands are consistently hitting 3.2% or higher. This disparity is often the result of industry-specific technological adoption. Refining your digital strategy to match these vertical-specific benchmarks ensures your marketing budget is driving actual growth rather than just subsidizing platform traffic.
Fashion, Beauty, and Consumer Goods
For established fashion and apparel brands, a conversion rate of 3% to 4% is the current gold standard. This sector has seen a significant boost in 2026 due to the widespread implementation of "Try-on" AR technology. These virtual fitting rooms have effectively neutralized the "fit and feel" barrier, reducing return rates while simultaneously increasing buyer confidence. The beauty sector remains a leader in loyalty-driven CVR, where repeat purchase cycles often push conversion rates toward the 5% mark for brands with strong retention programs.
Luxury, Furniture, and High-Ticket Items
When dealing with items priced over £1,000, the definition of "good" shifts dramatically. For luxury goods and high-end furniture, a conversion rate between 0.5% and 1.2% is considered high performance. The buyer journey for these items isn't measured in minutes, but in weeks or months. Success in this niche requires tracking attribution over 30 to 90 days. High-ticket brands must focus on high-touch digital interactions, using personalized consultations and immersive product visualizations to close sales that a standard checkout process cannot handle alone. Understanding these long-cycle behaviors prevents premature optimization of a funnel that isn't actually broken.
Variables That Dictate Your Specific "Good" Rate
Focusing purely on a percentage without context leads to strategic misalignment. A 1% conversion rate can be significantly more profitable than a 5% rate if the Average Order Value (AOV) justifies the acquisition cost. Generally, as the price point of a product increases, the conversion rate decreases proportionally. This inverse relationship is a fundamental law of e-commerce economics. Understanding what is a good conversion rate for ecommerce requires a deep dive into the specific variables that influence user behavior on your platform.
The "Mobile Gap" remains a critical factor in 2026. While mobile devices account for approximately 70% of online shopping traffic, their conversion rates still lag behind desktop counterparts. This isn't necessarily a failure of design; it's a reflection of user context. Mobile users are often multi-tasking and prone to distractions, which increases cognitive load. Success in this area depends on minimizing the steps to purchase and ensuring the value proposition is understood within seconds of landing. If your mobile CVR is less than half of your desktop rate, you've identified a clear technical or UX bottleneck.
Traffic Source and Intent
The quality of your traffic determines your conversion ceiling. Professional PPC Management produces higher CVR because it matches specific search intent with relevant landing pages. When a user searches for a specific solution, they're already positioned at the bottom of the funnel. In contrast, social media traffic often originates from "discovery-based" browsing where intent is passive. This usually results in a lower CVR, requiring a more robust retargeting strategy to close the sale. Referral and email channels typically boast the highest performance because they leverage existing trust and brand familiarity.
Price Point and Average Order Value (AOV)
Higher price points introduce psychological friction. A consumer purchasing a £50 item requires far less conviction than one investing £1,500. This is why high-ticket brands must prioritize Revenue Per Visitor (RPV) over simple conversion percentages. To maximize what is a good conversion rate for ecommerce at higher price points, you must focus on value perception rather than discounting. Strategic use of social proof, transparent supply chain data, and comprehensive product education can increase conversion without eroding your margins. Balancing these metrics ensures that your growth is sustainable and your marketing spend is optimized for profit, not just volume.
The Behavioral Science Behind High Conversion
Conversion is not a spreadsheet exercise; it's a behavioral outcome. While you may be focused on what is a good conversion rate for ecommerce, the number itself is merely a reflection of how effectively you've managed the user's psychological journey. In 2026, high-growth brands prioritize the reduction of cognitive load. When site navigation is intuitive and page load speeds are near-instant, you allow the brain to stay in "fast thinking" mode, where decisions are emotional and immediate. Complex layouts or slow responses force the user into "slow thinking," which leads to rationalization, hesitation, and ultimately, exit.
The 2026 market has shifted toward frictionless commerce. One-click behavioral triggers and biometric payments have set a new expectation for speed. Brands must also leverage social proof and urgency with precision. Using real-time inventory data or verified purchase notifications creates authentic urgency. However, you must avoid dark patterns that erode long-term trust. Transparency is now a competitive advantage; it's no longer just a legal requirement.
Trust Signals and Risk Reversal
Risk Reversal is the strategic process of eliminating the perceived psychological, financial, or functional danger a customer feels when considering a purchase. Trust icons and clear returns policies are foundational, but the landscape has evolved. By 2026, Buy Now, Pay Later (BNPL) options have become a primary driver of conversion. These tools allow consumers to defer financial commitment, effectively lowering the barrier to entry for higher-priced items. When combined with authentic, third-party reviews, these signals provide the validation needed to move a visitor toward a macro-conversion.
Optimising the Checkout Experience
Checkout friction remains the single largest revenue killer in digital retail. Data shows that approximately 70% of shoppers abandon their carts after starting the process. This drop-off is rarely due to a lack of interest. It's usually the result of a complicated form, unexpected costs, or a lack of guest checkout options. Implementing behavioral triggers, such as progress indicators and saved payment methods, can significantly reduce this abandonment rate. For a comprehensive look at these methodology-driven tactics, view our conversion rate optimization guide. If you're ready to stop guessing and start scaling through data, contact our digital strategy experts for a professional performance audit.
How to Audit and Improve Your Conversion Rate
Auditing your performance requires a clinical approach to data. To understand what is a good conversion rate for ecommerce in your specific context, you must first segment your traffic. Aggregated data often hides the truth. By isolating performance by device, channel, and landing page, you can pinpoint exactly where your strategy is succeeding or failing. This level of granularity is essential for moving beyond generic benchmarks and identifying the specific variables that drive your revenue.
The second step involves identifying leaky stages in your checkout funnel using GA4. If you see a 60% drop-off between "Add to Cart" and "Begin Checkout," the friction is likely related to price transparency or technical errors. Once the "Where" is established, run qualitative tests like heatmaps and user recordings to understand the "Why." Seeing a user struggle with a mobile navigation menu provides more actionable insight than a thousand spreadsheet rows. It's about observing behavior, not just counting clicks.
Implement A/B testing based on behavioral hypotheses. Don't change button colors because of a trend. Change them because your data suggests a specific cognitive barrier. This iterative cycle of measuring, testing, and refining is the only way to achieve sustainable growth. It's a cycle. Each test should lead to a measurable business result, ensuring that your optimization efforts are always tied to profit margins rather than vanity metrics. In 2026, the brands that win are those that treat what is a good conversion rate for ecommerce as a moving target of continuous improvement.
Professional CRO vs. DIY Tweaks
While DIY tweaks might offer temporary relief, hiring a conversion optimisation specialist ensures a systematic return on investment. A mere 0.5% increase in CVR can often double a brand's net profit by maximizing the efficiency of existing traffic. DIY optimization often falls into the trap of testing low-impact variables, whereas professional strategy focuses on high-leverage behavioral triggers. We focus on the data that matters.
Next Steps for Scottish E-commerce Brands
For Scottish e-commerce brands targeting both UK and global markets, local expertise is vital. Understanding the nuances of regional consumer behavior and logistical expectations can be the difference between a stalled business and a market leader. At Behaviour Digital, we combine high-performance PPC with methodological CRO to deliver holistic growth. We don't just drive traffic; we convert it. Book a data-driven audit today to uncover the hidden revenue in your current funnel.
Transforming Benchmarks into Bottom-Line Growth
Understanding what is a good conversion rate for ecommerce requires moving beyond surface-level percentages. Success in 2026 is defined by how well you align your digital strategy with industry-specific benchmarks while simultaneously reducing the cognitive load on your users. We've established that sustainable profitability isn't just about traffic volume; it's about the methodological precision of your funnel and the quality of your behavioral triggers. By auditing your data through the lens of device-specific intent and price-point friction, you move from guesswork to strategic certainty.
As a data-driven Glasgow agency, Behaviour Digital specializes in the seamless integration of PPC and CRO to drive measurable business development. Our expertise in behavioral growth ensures that every user interaction is a deliberate step toward a transaction. It's time to stop settling for industry averages and start outperforming your competition through quantitative analysis. Book a Conversion Rate Audit with Behaviour Digital to uncover the hidden revenue in your current funnel and build a roadmap for scalable growth. Your data is ready to tell a more profitable story.
Frequently Asked Questions
What is a good conversion rate for a new e-commerce store?
For a new store, a good conversion rate typically falls between 1% and 1.5%. Since new businesses often lack established brand trust and historical data, reaching the Shopify average of 1.4% is a significant initial milestone. Initial efforts should focus on stabilizing the checkout funnel and gathering enough session data to identify technical bottlenecks before scaling paid traffic.
How does mobile conversion rate compare to desktop in 2026?
Mobile conversion rates generally remain lower than desktop, despite mobile devices accounting for approximately 70% of total online orders. Desktop users typically convert at a rate 1.5 to 2 times higher than mobile users. This is because the desktop environment provides lower cognitive load and fewer distractions, though biometric payments in 2026 are rapidly narrowing this performance gap.
Does a high conversion rate always mean my business is profitable?
No, a high conversion rate does not guarantee profitability if your Average Order Value (AOV) is low or your customer acquisition costs are unsustainable. A 5% conversion rate on low-margin products can be less profitable than a 1% rate on high-ticket luxury items. True business health is measured by the balance of conversion, AOV, and net margin, rather than a single vanity metric.
What are the main reasons for a low e-commerce conversion rate?
Low conversion rates are primarily driven by checkout friction, poor mobile optimization, or a mismatch between marketing intent and landing page content. If your cart abandonment rate exceeds the 70% average, the issue usually lies in unexpected shipping costs, a lack of guest checkout options, or slow site speed. These technical and psychological barriers prevent users from completing their journey.
How often should I benchmark my conversion rates against competitors?
You should conduct a formal benchmark audit quarterly to ensure your digital strategy remains competitive. While internal month-over-month tracking is vital for measuring the impact of specific changes, quarterly industry comparisons provide the necessary context to determine if your growth is keeping pace with the wider market. Regular auditing prevents your brand from falling behind shifting consumer expectations.
Can PPC ads improve my overall website conversion rate?
Yes, professionally managed PPC ads can improve your overall site conversion rate by filtering for high-intent traffic. Unlike discovery-based social media browsing, search-based PPC captures users who are actively looking for a solution. This alignment of intent and offer is a critical factor in determining what is a good conversion rate for ecommerce for your specific business model.
What is the average conversion rate for Shopify stores in 2026?
As of June 2026, the average conversion rate for Shopify stores is 1.4%. Performance in the top 20% of stores requires a conversion rate of 3.2% or higher. To reach the elite top 10% of performers on the platform, a store must achieve a conversion rate of at least 4.7%, reflecting the high efficiency of their user experience and trust signals.
How do I calculate my e-commerce conversion rate correctly?
Calculate your conversion rate by dividing the total number of completed transactions by the total number of unique website sessions during the same period, then multiplying by 100. It's essential to use session-based data rather than raw pageviews. This provides a more accurate reflection of how many individual shopping journeys resulted in a successful business outcome.
.png)


.svg)

.svg)


.png)

.svg)